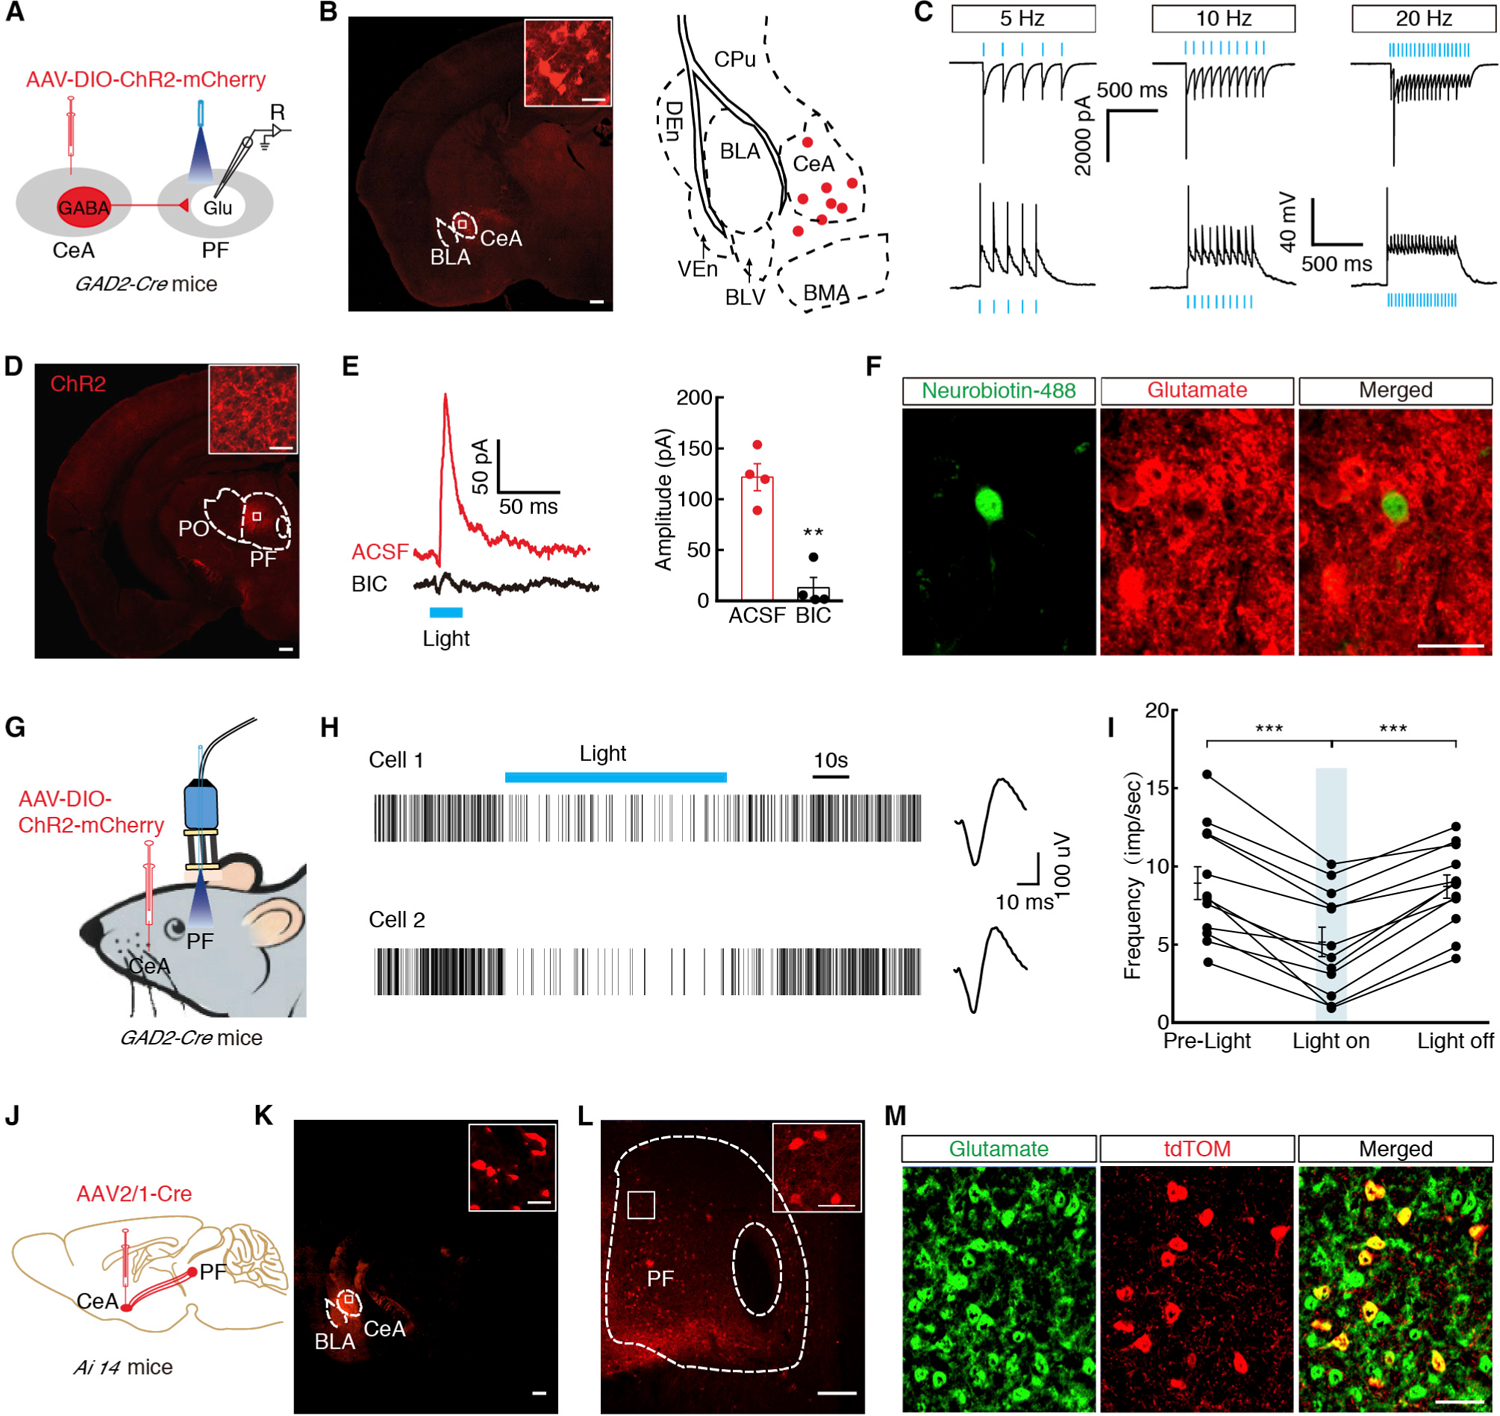
Figure 2. Identification of the Functional Connection of the GABACeA→GluPF Pathway.

(A) Schematic of CeA injection of AAV-DIO-ChR2-mCherry in GAD2-Cre mice and recording configuration in acute slices.
(B) Typical images (left) and infusion sites (right) of an AAV-DIO-ChR2-mCherry viral expression in the CeA of GAD2-Cre mice (scale bar, 200 μm). The white boxes depicting the area shown in the box of the CeA (scale bar, 20 μm).
(C) Sample traces of action potentials evoked by 473 nm light recorded from CeA mCherry+ neurons in acute brain slices.
(D) The images showed ChR2-containning GABACeA terminals in the PF, which were spliced with a confocal microscope. Scale bar, 200 μm. The white boxes depicting the area shown in the box of the PF. Scale bar, 20 μm.
(E) Representative traces (left) and summarized data (right) of light-evoked currents (473 nm, 10 Hz, 20 ms, blue bar) before and after bicuculline (BIC, 10 μM, n = 4 neurons).
(F) Representative images of neurobiotin-488 (green), anti-glutamate immunostaining (red), merged (yellow) showing glutamate neurons by post hoc staining after patch in (E). Scale bar, 20 μm.
(G) Schematic of in vivo recording of freely moving GAD2-Cre mice.
(H and I) Representative traces (H) and summarized data (I) showed the firing rate of the PF neurons in the GAD2-Cre mice before, during, and after light photostimulation with multiple channel recordings (n = 14 neurons).
(J) Schematic of trans-monosynaptic AAV2/1-Cre virus tracing strategy.
(K) Typical images of an AAV2/1-Cre injection site and viral expression in the CeA of Ai14 mice (scale bar, 200 μm). The white boxes depicting the area shown in the box of the CeA (scale bar, 20 μm).
(L) Typical images of viral expression in the PF. Scale bar, 200 μm. The white boxes depicting the area shown in the boxes of the PF. Scale bar, 20 μm.
(M) tdTomato-labeled neurons within the PF traced from the CeA (seen in L) were co-localized with glutamate immunofluorescence. Scale bar, 50 μm.
All of the data are presented as mean ± SEM. **p < 0.01, ***p < 0.001. Paired t test for (E). One-way repeated-measures ANOVA with Bonferroni post hoc analysis is for (I). See also Figure S3.
