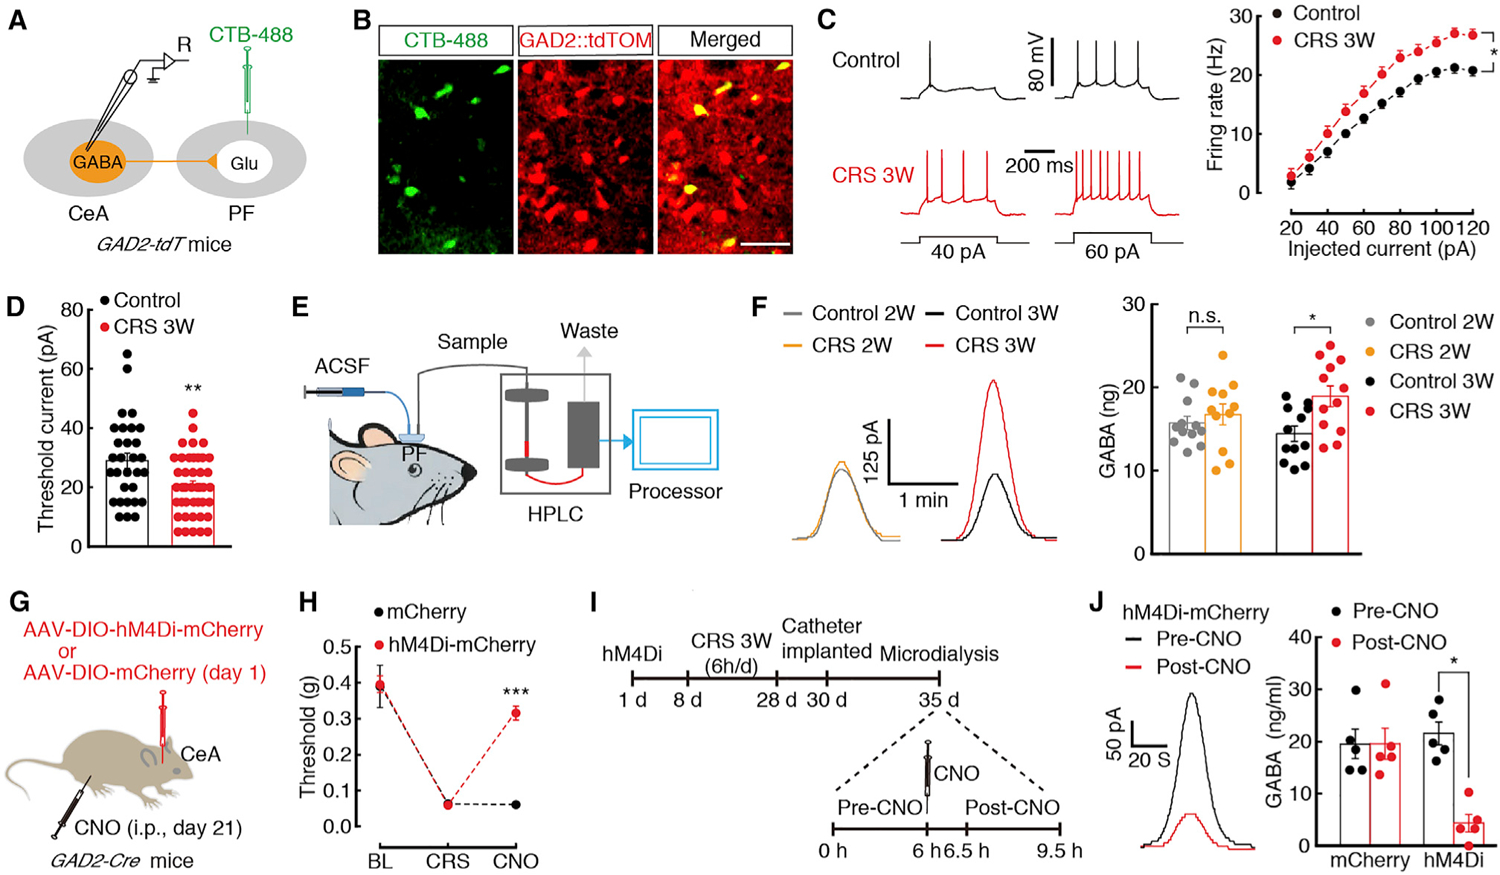
Figure 4. Enhanced Inhibition of the GABACeA→GluPF Pathway in CP.

(A) Schematic of CTB-488 injection and recording configuration in acute slices.
(B) Representative images of GABACeA neurons (yellow) labeled by CTB-488 (green) injected in the PF of GAD2-tdTOM mice (neurons with red tdTOM). Scale bar, 50 μm.
(C and D) Sample traces and statistical data for firing rate (C) and rheobase (D) recorded from PF-projecting GABACeA neurons (yellow cells in B) in mice treated with control (n = 30 neurons) or CRS 3W (n = 42 neurons).
(E) Schematic of microdialysis-HPLC detection in freely moving mice with probe implanted in the PF.
(F) Sample traces (left) and summarized data (right) of GABA signal in the PF from the indicated groups (n = 11–12 mice per group).
(G) Schematic of chemogenetics in GAD2-Cre mice.
(H) Behavioral effects of the chemogenetic inhibition of GABACeA neurons on pain threshold at 30 min after CNO intraperitoneal injection (i.p., n = 5 mice per group).
(I) Timeline of microdialysis-HPLC detection.
(J) Sample traces (left) and summarized data (right) of GABA signal in the PF before and after CNO injection (n = 5 mice per group).
All of the data are presented as mean ± SEM. *p < 0.05, **p < 0.01, ***p < 0.001. Unpaired t test for (D); paired t test for (J); two-way Repeated-measures ANOVA with Bonferroni post hoc analysis for (C) and (H); one-way ANOVA with Bonferroni post hoc analysis for (F). See also Figures S5 and S6.
