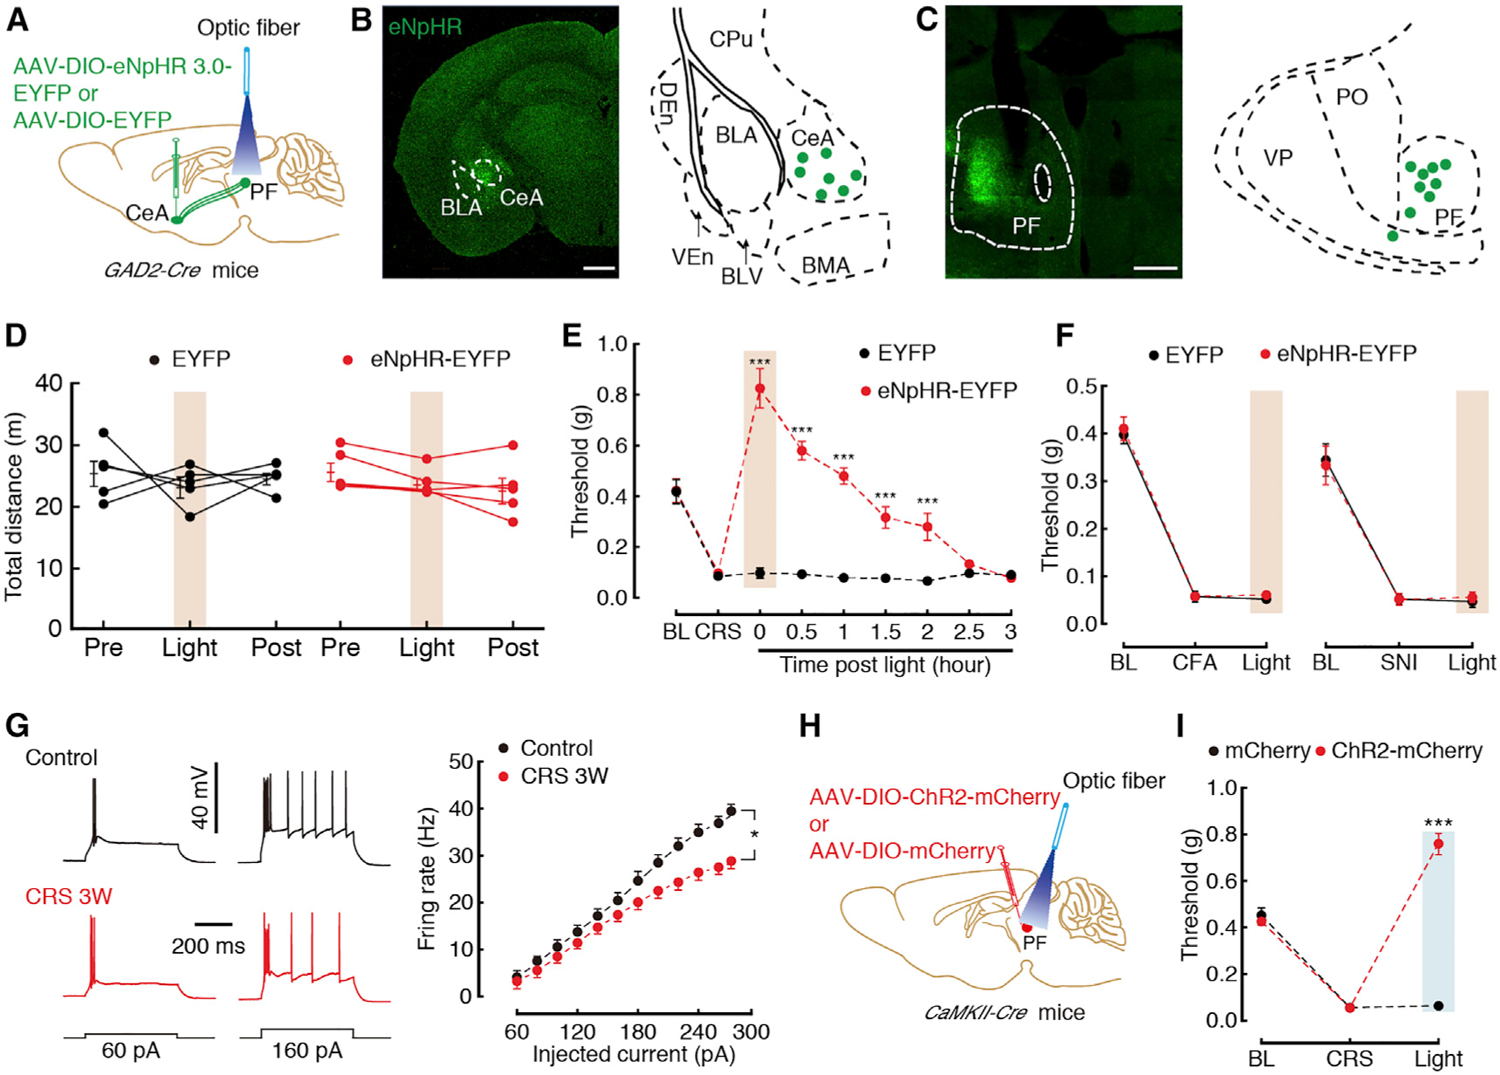
Figure 5. Necessary and Sufficient Role of the GABACeA→GluPF Pathway for CP.

(A) Schematic of optogenetic experiments in GAD2-Cre mice.
(B) Typical image (left) and injection sites (right) within the CeA. Scale bar, 200 μm.
(C) Typical image (left) that were spliced with a confocal microscope, and optic fiber sites (right) within the PF. Scale bar, 200 μm.
(D) Locomotion of the open-field test before, with, and after light photostimulation in the EYFP (n = 5) or eNpHR3.0-EYFP mice (n = 5).
(E) Effects of optogenetic inhibition of GABACeA terminals in the PF on pain threshold in CRS 3W mice (n = 5 mice per group).
(F) Effects of optogenetic inhibition of GABACeA terminals in the PF on pain threshold in CFA (at day 3) or SNI (at day 7) mice (n = 5–6 mice per group).
(G) Sample traces (left) and statistical data (right) of action potential firing recorded from GluPF neurons in CaMKII-tdT mice treated with CRS 3W (n = 56 neurons) or control (n = 33 neurons).
(H) Schematic of optogenetic experiments in CaMKII-Cre mice.
(I) Behavioral effects of optogenetic inhibition of GluPF neurons on pain threshold in CaMKII-Cre mice treated with CRS 3W (n = 5 mice per group).
All of the data are presented as mean ± SEM. *p < 0.05, ***p < 0.001. Two-way repeated-measures ANOVA with Bonferroni post hoc analysis for (D)–(G) and (I). See also Figures S7–S9.
