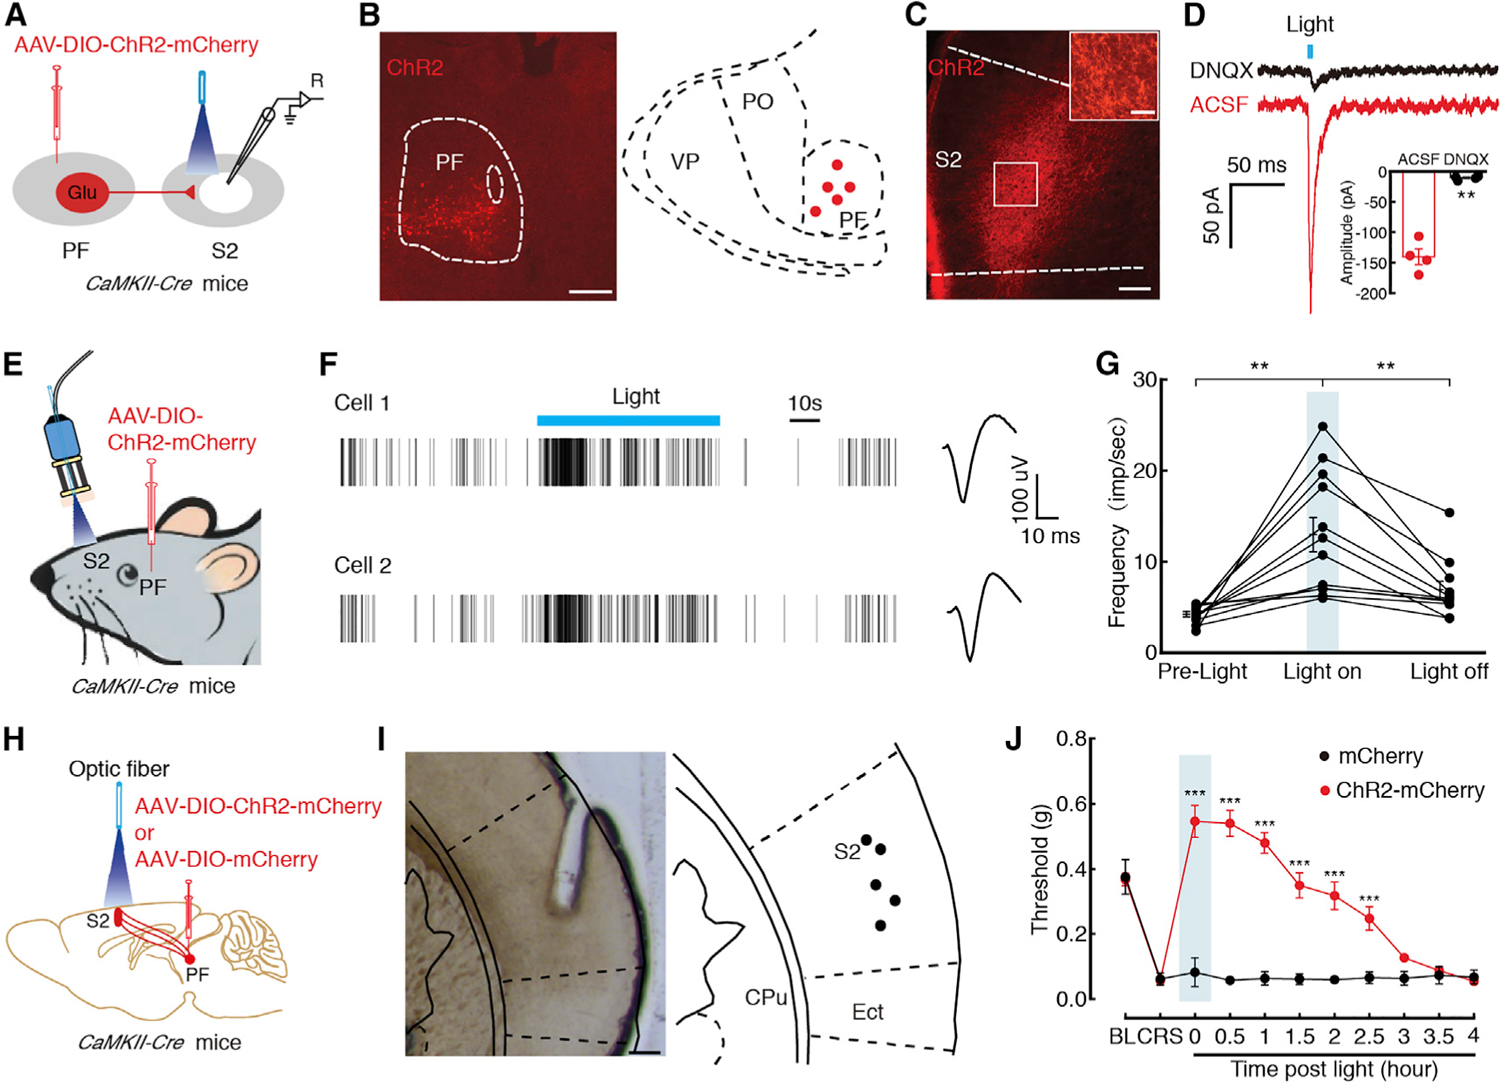
Figure 6. The GABACeA→GluPF→S2 Pathway Controls CP-like Behavior.

(A) Schematic of viral infection and whole-cell recording configuration in acute slices.
(B) Typical image (left) and injection sites (right) with AAV-DIO-ChR2-mCherry of PF in CaMKII-Cre mice. Scale bar, 200 μm.
(C) Representative images of mCherry signals in the S2 at day 21 after PF infusion of AAV-DIO-ChR2-mCherry in CaMKII-Cre mice. Scale bar, 100 μm. The white boxes depicting the area shown in the box of the S2. Scale bar, 20 μm.
(D) Representative current traces (left) and summarized data (right, n = 4 neurons) evoked through photostimulation of ChR2-containing GluPF terminals in the S2 before and after DNQX (10 μM).
(E) Schematic of in vivo recording of freely moving CaMKII-Cre mice.
(F and G) Representative traces (F) and summarized data (G) showed the firing rate of the S2 neurons in the CaMKII-Cre mice before, with, and after light photostimulation with multiple channel recordings (n = 12 neurons).
(H) Schematic of optogenetic experiments in CaMKII-Cre mice.
(I) Typical image (left) and optic fiber sites (right) within the S2. Scale bar,100 μm.
(J) Behavioral effects of optical activation of GluPF terminals in the S2 on pain threshold (n = 5 mice per group).
All of the data are presented as mean ± SEM. **p < 0.01; ***p < 0.001. Paired t test for (D); one-way repeated-measures ANOVA with Bonferroni post hoc analysis for (G); two-way repeated-measures ANOVA with Bonferroni post hoc analysis for (J). See also Figure S10.
