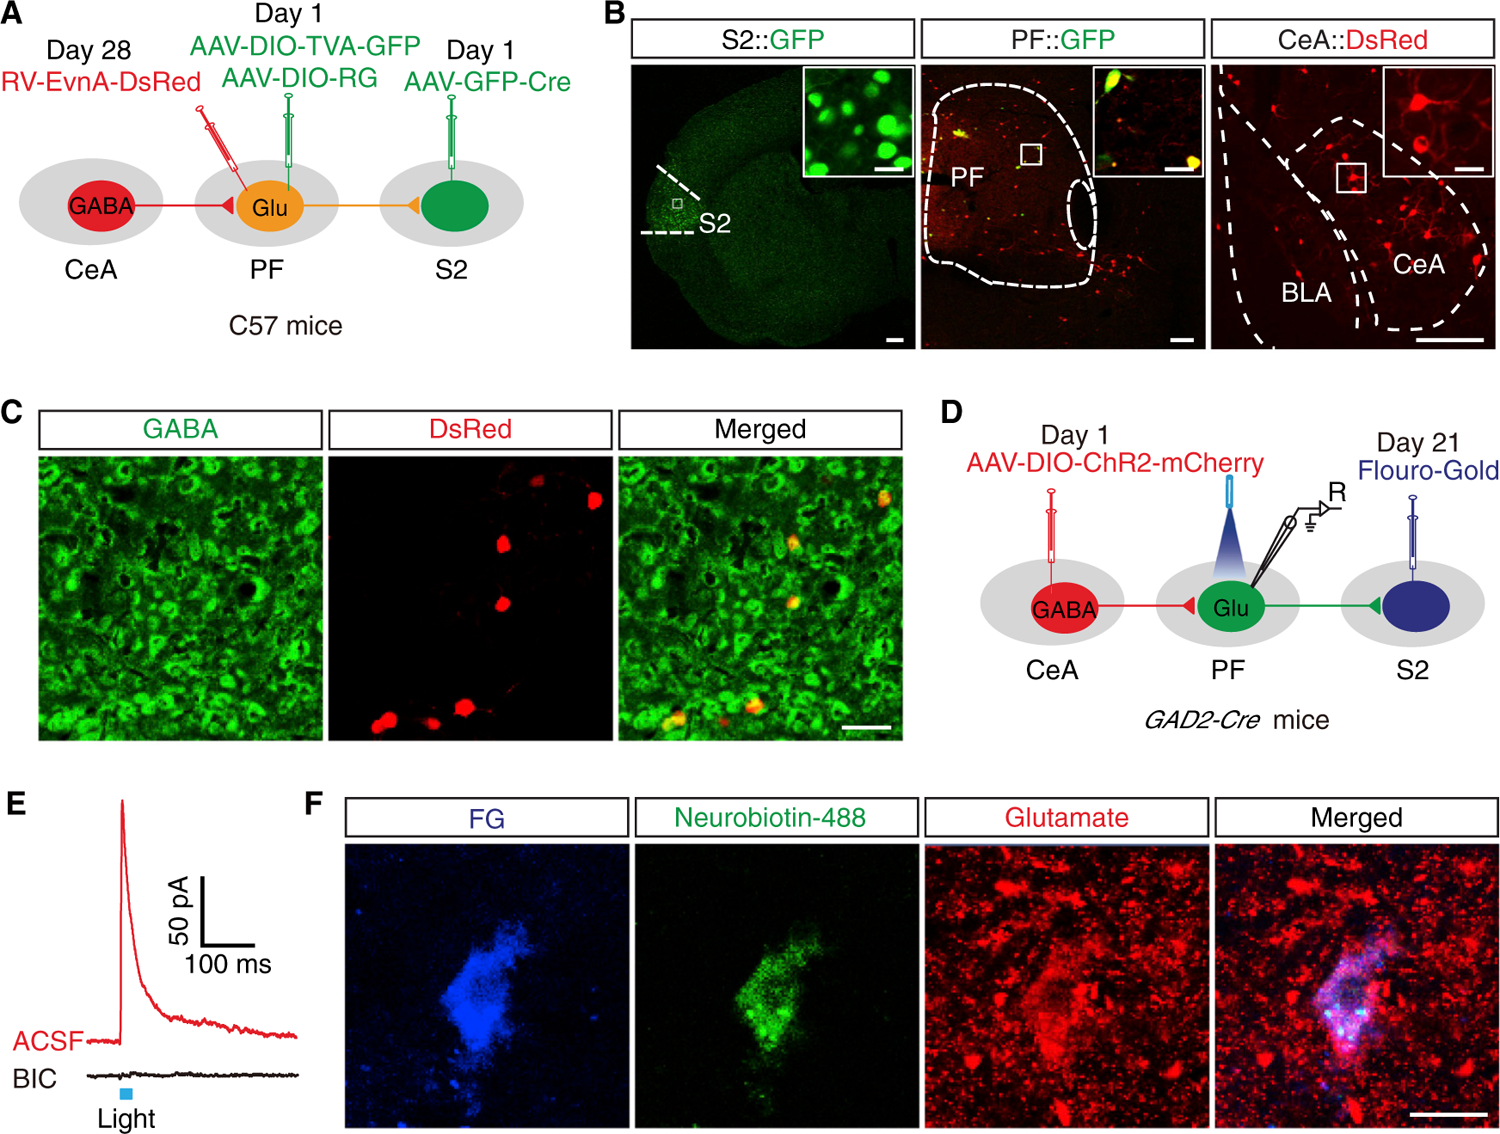
Figure 7. The GABACeA→GluPF→S2 Pathway Were Identified.

(A) Schematic of viral injection for triple retrograde tracing.
(B) Left: images of an AAV-GFP-Cre injection site in the S2, scale bar, 200 μm; Middle: images of AAV-GFP-Cre and AAV helper co-expression in the PF, scale bar, 200 μm; Right: images of RV-labeled neurons in the CeA, scale bar, 100 μm. The white boxes depicting the area shown in the boxes of the S2, PF, and CeA. Scale bars, 20 μm.
(C) DsRed signals traced from the PF in (B, right) were co-localized with GABA immunofluorescence in the CeA. Scale bar, 100 μm.
(D) Schematic of viral and FG injection and whole-cell recording configuration in acute slices from GAD2-Cre mice.
(E) Representative current traces evoked through photostimulation (blue bar) before and after bath application bicuculline (BIC, 10 μM).
(F) Representative images of FG (blue), neurobiotin-488 (green), anti-glutamate immunostaining (red), and merged showing glutamate neurons by post hoc staining after patch in (E). Scale bar, 20 μm.
See also Figures S11 and S12.
