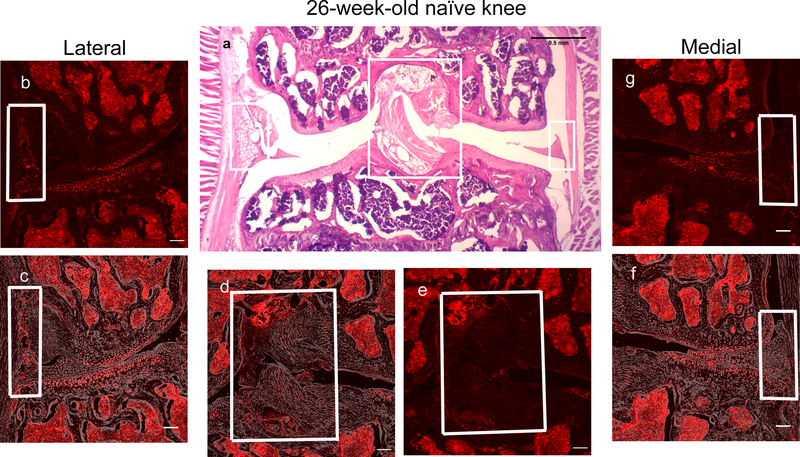
Figure 3.
Representative histological images of the right knee joint of a 26-week-old NaV1.8-tdTomato mouse. (a) H&E staining. Scale bar = 500 μm; (b,e,g) Confocal images of NaV1.8-tdTomato expressing afferent nerve fibers within the lateral, middle, and medial parts of the knee joint, respectively; (c,d,f) Overlays of the NaV1.8-tdTomato images with phase-contrast to show the general structures of the joint; (b-g) Scale bar = 100 μm.

