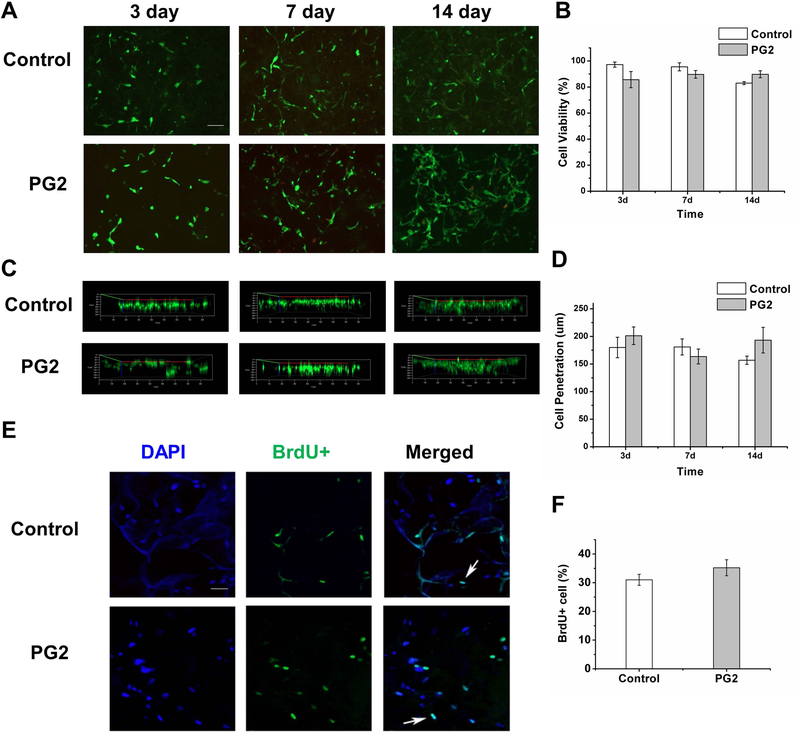
Figure 3.
PG2 is biocompatible in vitro. Representative images of HDFs in PG2 and Control at 3, 7 and 14 days of culture, stained by Live/Dead assay (Green: live cells labeled by calcein AM; red: dead cells labeled by ethidium homodimer-1) (A), scale bar = 100 μm, quantified in B; representative 3D reconstruction of the Z-stack images showing the extent of cell migration in PG2 and Control at 3, 7 and 14 days (C), quantified in D; representative images of HDFs in PG2 and Control showing the extent of BrdU incorporation using BrdU assay (Blue: DAPI; green: BrdU) (E), scale bar = 50 μm, quantified in F.

