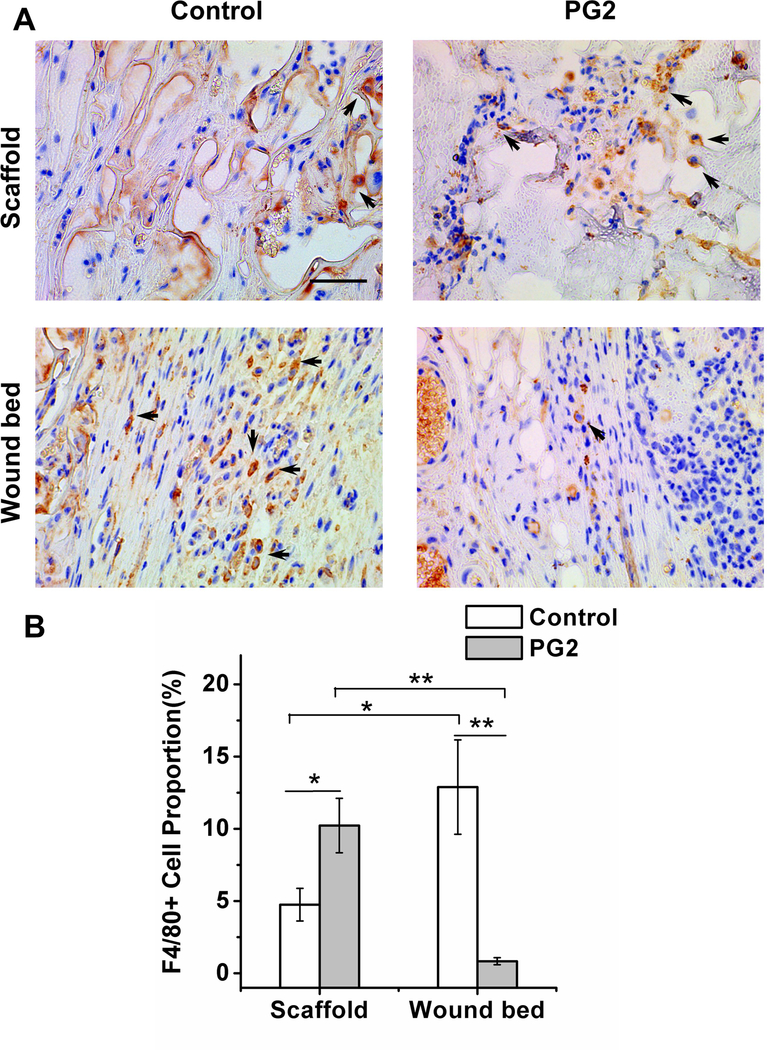
Figure 5.
Unlike the scaffold area, wound bed of the PG2 sccafold has less number of F4/80+ve macrophages. Histological sections of wounds treated with PG2 and Control on day 20, stained with F4/80 (macrophages as arrows indicated) (A), scale bar = 50 μm; quantification of F4/80+ve cell (macrophage) proportion on wounds with different treatments at two different locations (B).

