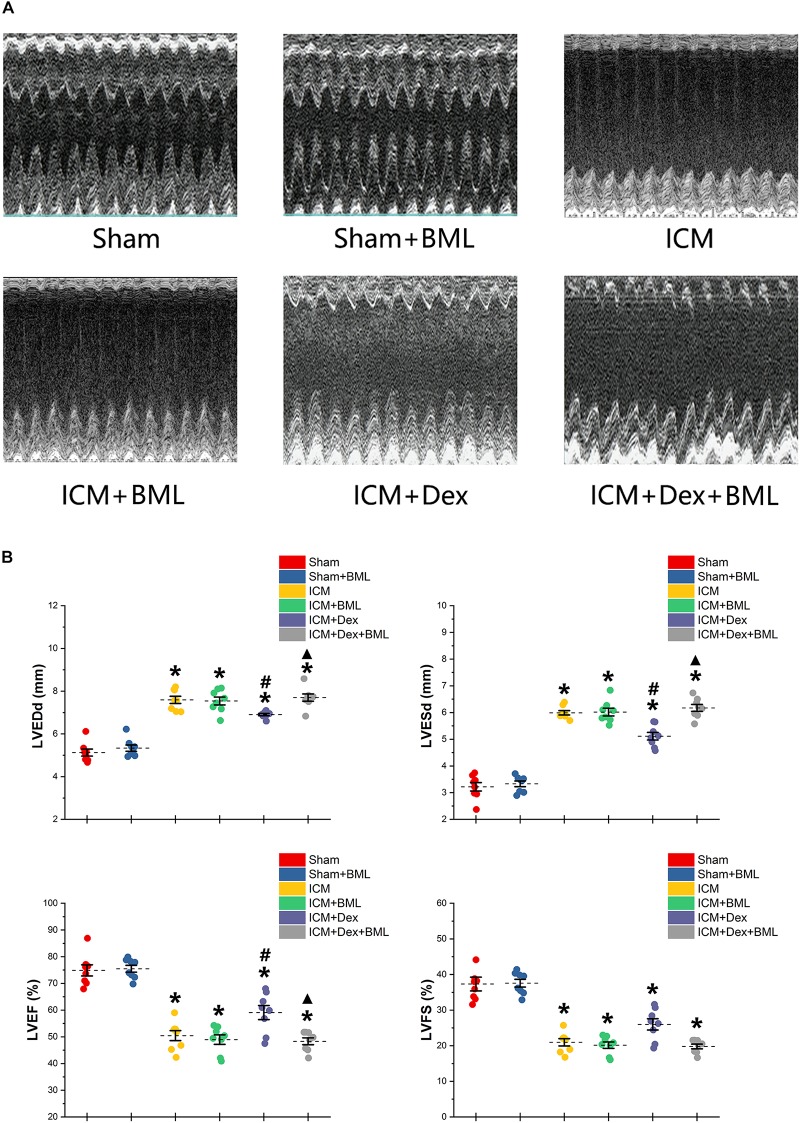
FIGURE 3.
(A) Representative M-mode echocardiograms of short-axis views from each group after 4-week treatment. (B) Changes in echocardiographic properties. Larger LVEDd and LVESd and smaller LVEF and FS developed in the ICM group than in the Sham group. Lower LVEDd and LVESd and higher LVEF developed in the ICM + Dex group than in the ICM group. BML partly attenuated the effects of Dex on echocardiographic parameters. Data are expressed as mean ± SD. *p < 0.05 vs. Sham group, #p < 0.05 vs. ICM group, ▲p < 0.05 vs. ICM + Dex group (n = 8 for each group).

