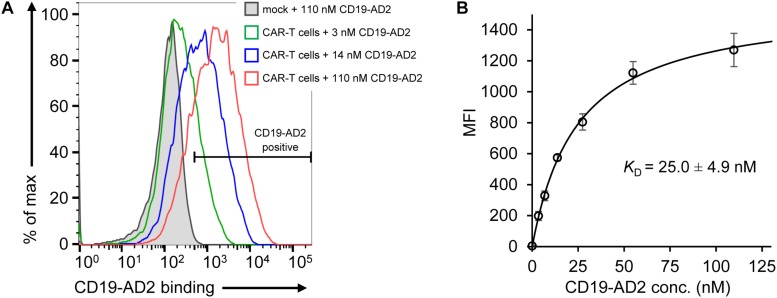
FIGURE 3.
Binding of CD19-AD2 to CD19-directed CAR-T cells. (A) CAR-T cells were incubated with various concentrations of CD19-AD2-AF555 (three representative concentrations are shown) and subjected to flow cytometry. The filled gray histogram represents the incubation of mock-T cells with the highest concentration of CD19-AD2-AF555. One experiment representative of four independent experiments is shown. (B) CD19-AD2 binding isotherm was generated by fitting the data points obtained from titrating CD19-AD2-AF555 to CAR-T cells to a one-set-of-sites binding model (KD = 25.0 ± 4.9 nM, n = 4).

