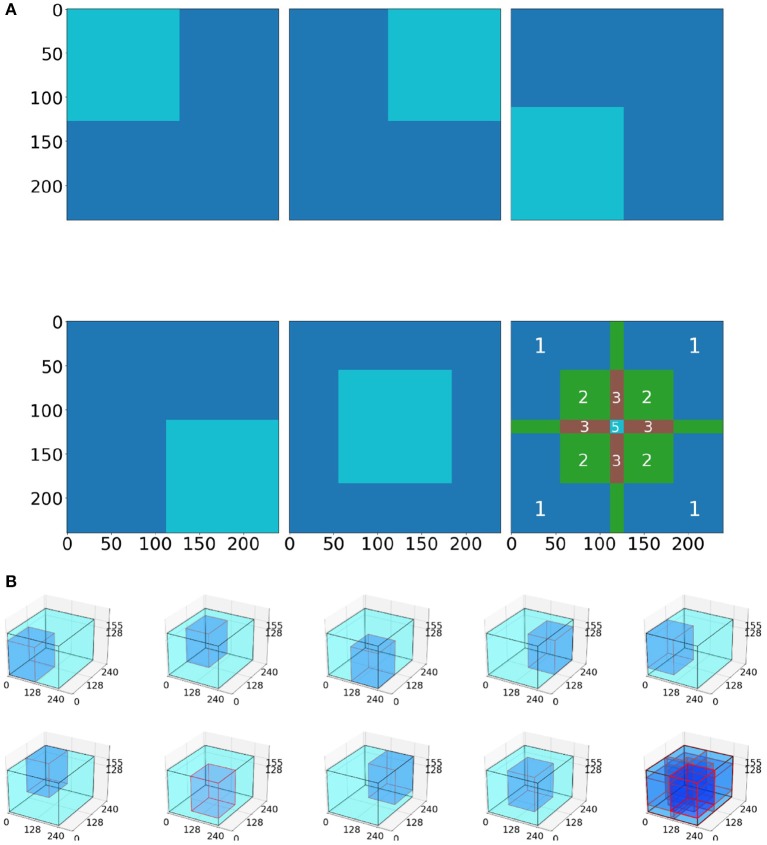
Figure 4.
Tiling process schematic. (A) In the 2D model, five tiles (4 corners, 1 center) are averaged to produce the whole image prediction. The 3rd picture in the 2nd row depicts the intensity of the tile overlapping. Notably, the tile predictions are either (i) first rounded and then averaged together, or (ii) first averaged together and then rounded. (B) Example for the 3D BraTS model, where the tiling algorithm is similar with the 2D, but this time uses nine tiles (8 corners and 1 center).

