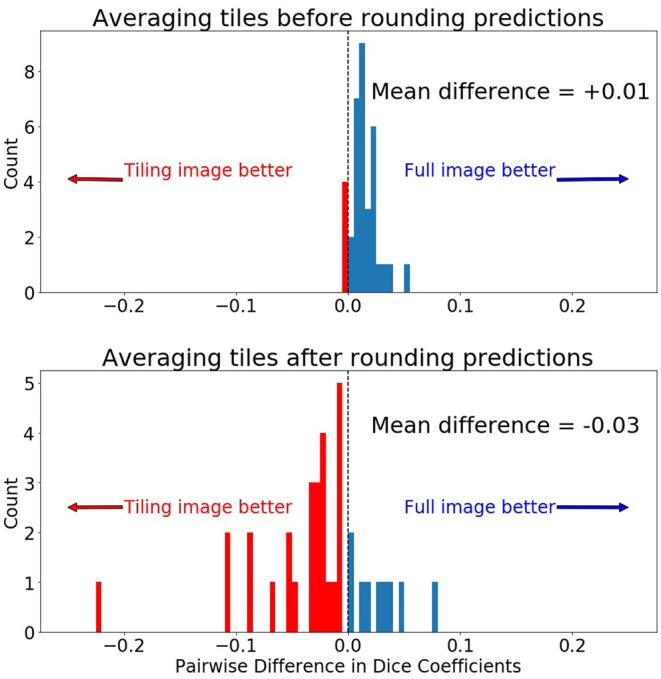
Figure 6.

Comparing pairwise Dice differences between the prediction on the whole 240 × 240 image and the 128 × 128 tiles. Zero indicates both methods produced equal Dice scores for the same scan. (Top) Prediction was made by first averaging the 5 tiles and then rounding the final prediction to 0 or 1. (Bottom) Prediction was made by first rounding the tiled predictions to 0 or 1 and then averaging the predictions.
