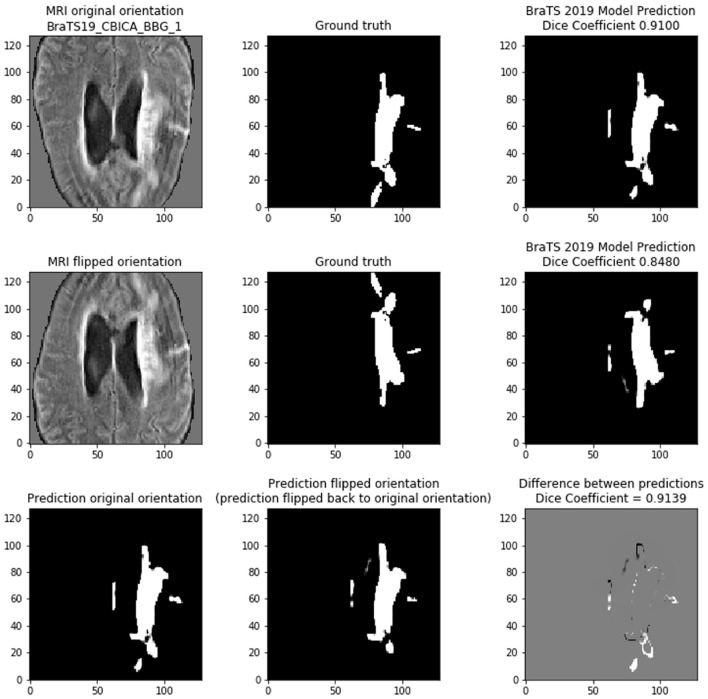
Figure 8.
Demonstrating the variability of the 2D BraTS model. (Top) Prediction based on normal orientation of the MRI input. (Middle) Prediction based on vertical flip of the MRI input. (Bottom) Comparing the predictions of the normal and flipped inputs. The prediction of the flipped input was re-flipped to allow direct comparison with the normal orientation prediction. In bottom right figure, gray pixels indicate no difference, black pixels are in the flipped prediction but are not present in the normal prediction, and white pixels are in the normal prediction but are not present in the flipped prediction.

