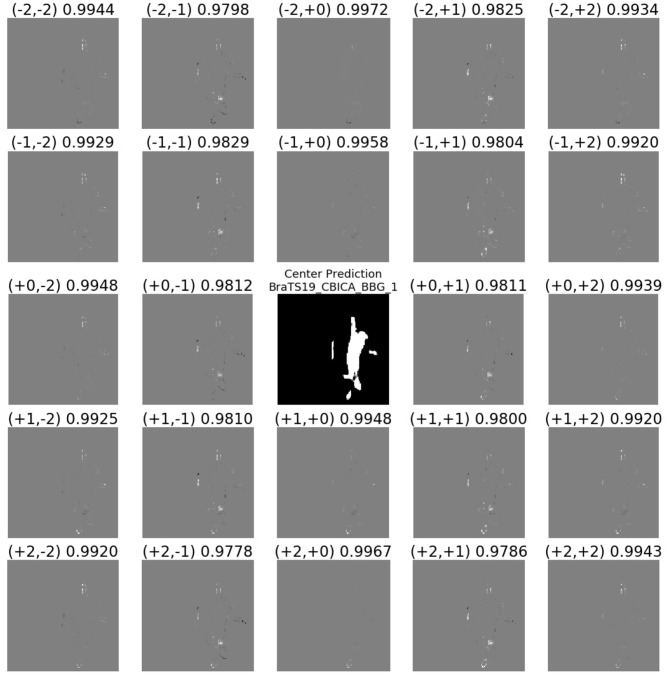
Figure 9.
Demonstrating the translational variance of the 2D BraTS model. The center shows the prediction of the model on a 128 × 128 center crop of the MRI. Note the entire tumor fits within this tile. The surrounding subplots show the difference in the prediction as the MRI input crop is offset by one or two pixels in either dimension of the slice. The differences between the predictions in the overlapping pixels show that even the smallest translation in the input can create a difference in the output. Gray pixels indicate no difference in the predictions of the overlapping pixels between the center crop and the offset crop, black pixels are in the offset-crop prediction but are not present in the center-crop prediction, and white pixels are in the center-crop prediction but are not present in the offset-crop prediction.

