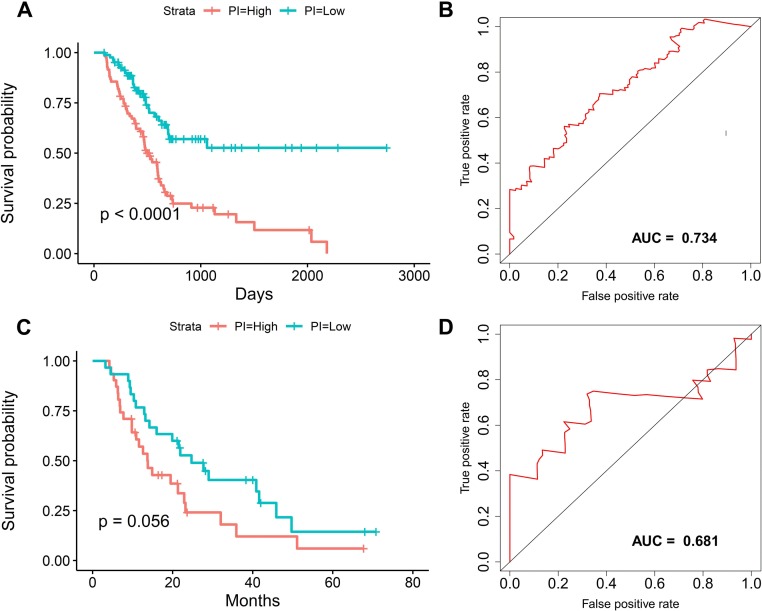
Figure 6. The survival prediction performance of the prognostic index.
(A) Kaplan–Meier survival plots suggested that patients in the high-risk group could expect a poor survival. (B) ROC curves with calculated AUCs of prognostic signatures built in the PAAD cohort for risk prediction over 1,500 days.

