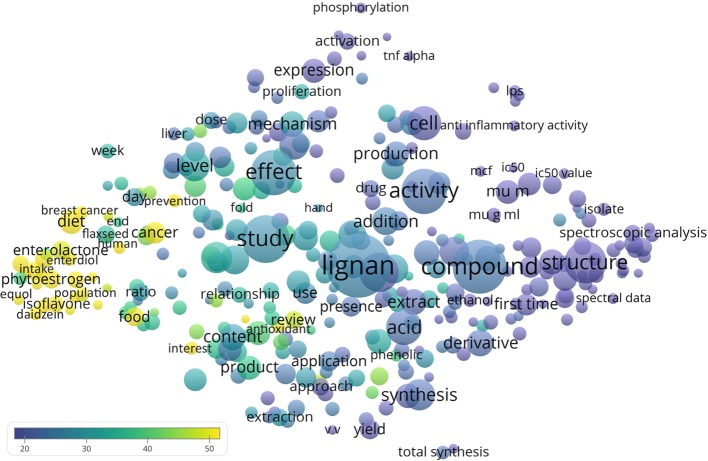
Figure 1.
Bubble map visualizing words from titles and abstracts of the 10,742 lignan publications. VOSviewer software was used to evaluate the recurring terms. Only the 311 terms that appeared in at least 1% (n = 108) of the publications were analyzed and visualized. The size of a bubble represents the frequency of appearance of a term (multiple appearances within one publication were treated as one appearance). Two bubbles are positioned more closely to each other if the terms co-appeared more often. The color represents the averaged citations per publication.

