Figure 3.
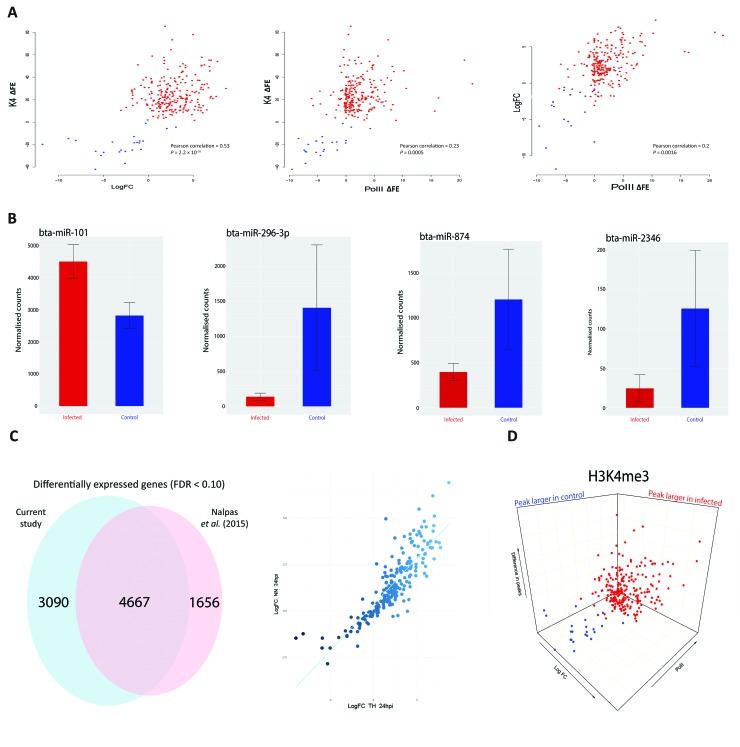
H3K4me3 is accompanied by functional changes in Pol II occupancy, gene expression and gene regulation. (A) Scatter plots of H3K4me3 against Pol II occupancy and gene expression. The first plot is the difference of peaks for H3K4me3 between conditions. The values on the y-axis correspond to the difference in fold enrichment (ΔFE) of each peak at each gene between the control and infected groups. A positive value (x) means that the peak was x-fold enriched in the infected cells (red dots) compared to the control cells. Negative values correspond to the peaks being larger in the control (blue dots), indicating a decrease or total depletion of the peak in the infected cells. The x-axis represents the log2FC for each of the 232 genes, with each gene as a single data point. The second plot also has H3K4me3 on the y-axis but with peak differences in Pol II on the x-axis, with negative and positive values corresponding to greater occupancy in the control and infected samples, respectively. The final plot shows log2FC relative to Pol II occupancy. (B) Plots of normalised miRNA-seq counts. Each plot represents the normalised counts of a miRNA that was detected as exhibiting differential expression. Bta-miR-101 interacts with ARG2, bta-miR-296-3p with TMEM173 (aka STING), bta-miR-874 with BCL2A1 and bta-miR-2346 with STAT1. Red bars indicate infected and blue represent control samples. (C) Correlation and Venn diagram for both RNA-seq studies. The x-axis of the scatter plot represents the log2FC for each of the 232 genes from this study and the y-axis represents the log2FC for each of the 232 genes from the previous study (Nalpas et al., 2015). The Venn diagram shows the global overlap of differentially expressed genes from both studies with an FDR cut-off < 0.1. (D) 3-D plots for all three data sets. A combination of all three scatter plots from Figure 3A. Data points are genes. Blue genes are those that exhibited greater H3K4me3 in control bAM; red exhibited greater H3K4me3 in infected bAM.

