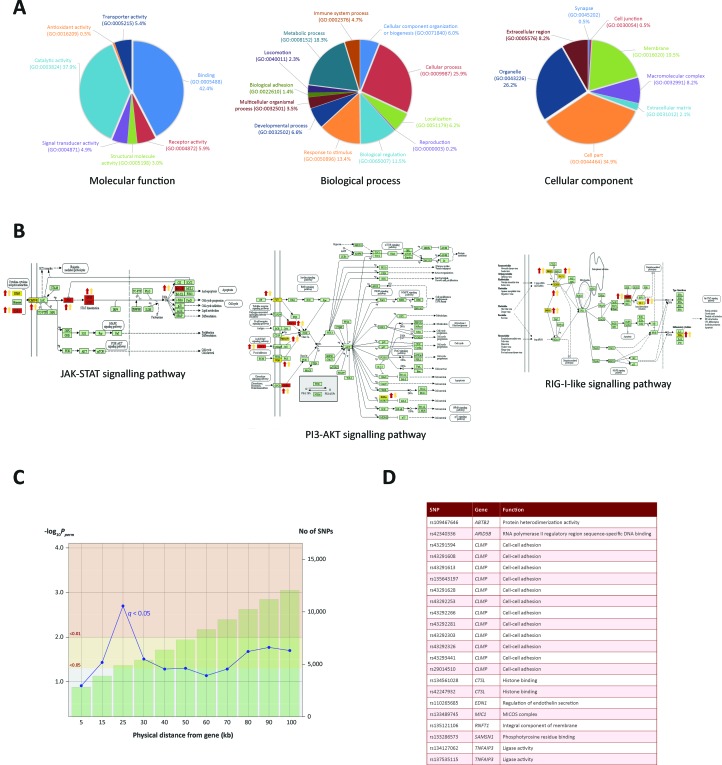
Figure 4.
Gene ontology enrichment and pathway analysis. (A) Gene ontology pie charts generated through PANTHER pathway analysis; 232 genes cluster by gene ontology under three main categories: Biological process, Cellular component and Molecular function. (B) KEGG pathway images containing genes identified from the ChIP-seq and RNA-seq analysis. Gene symbols coloured in yellow were identified in the ChIP-seq and RNA-seq analysis. Gene symbols coloured in red were also targeted by one or more differentially expressed miRNAs. Up or down red arrows indicate greater H3K4me3 in infected or control, respectively. Up or down yellow arrows indicate log2FC increase or decrease of the associated gene, respectively. (C) Line graph showing different genomic ranges from genes that are enriched for significant SNPs from GWAS data for bTB resilience. The bars represent the number of SNPs that occupy each range from each ChIP-seq enriched gene, with more SNPs correlating with a greater distance. The blue plotted line represents the negative log10 probability that the significant SNPs found at each distance at 0.05 FDR q value are significant by chance, with SNPs at 25 kb exhibiting the lowest probability. The null SNP P value distribution for each data point was generated from 1,000 permutations of random SNPs corresponding to the number of SNPs observed in a particular genomic range. (D) Genes enriched for SNPs significantly associated with resilience to M. bovis infection. SNP IDs and functional information obtained from the GeneCards® database (Stelzer et al., 2016) are also shown.

