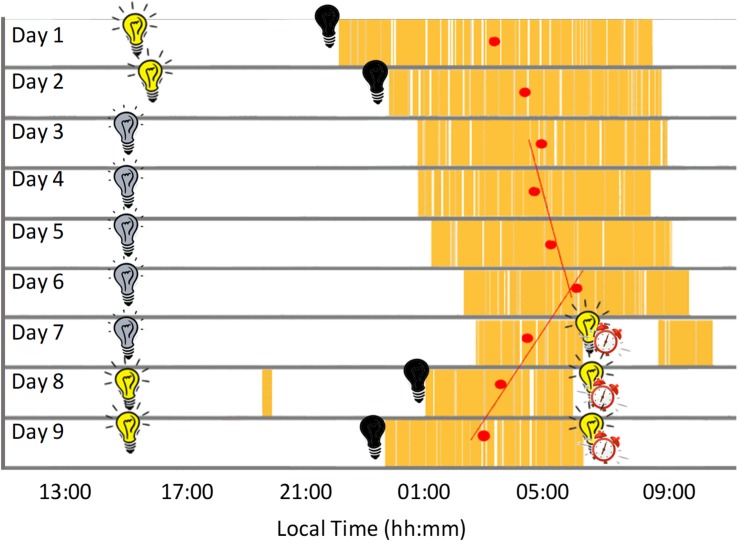
FIGURE 3.
Actogram built from the daily records showing sleep periods in yellow and mid-sleep time (red circles) for each night. Black bulb indicates darkness, yellow bulb indicates bright light (Stage 1, self-selected light/dark cycle), gray bulb indicates dim light (Stage 2) and alarm clock indicates light/dark cycle with early wake up (Stage 3).

