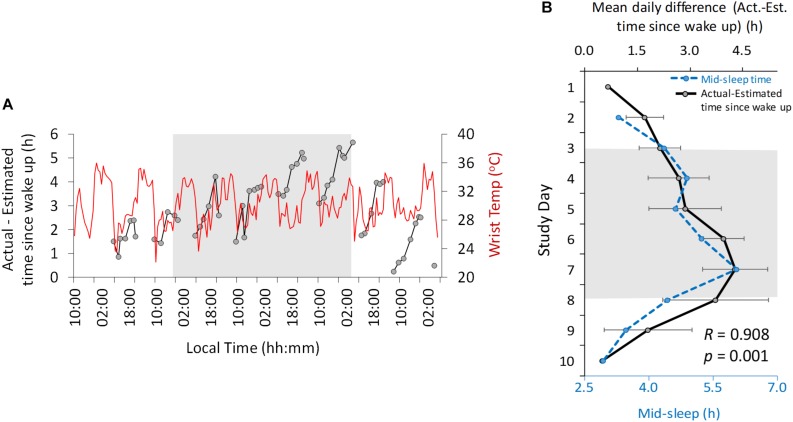
FIGURE 4.
Ten-day ambulatory recordings of wrist temperature rhythm (red) plotted with the difference between actual and estimated time since wake up (black, A). Daily mean difference (± SD) between actual and estimated time since wake up (B, solid line, black) with mid-sleep time (dashed line, blue). Gray area indicates Stage 2 (constant dim light). Previous and subsequent days correspond to Stage 1 (self-selected light/dark cycle) and Stage 3 (light/dark cycle with early wake up), respectively.

