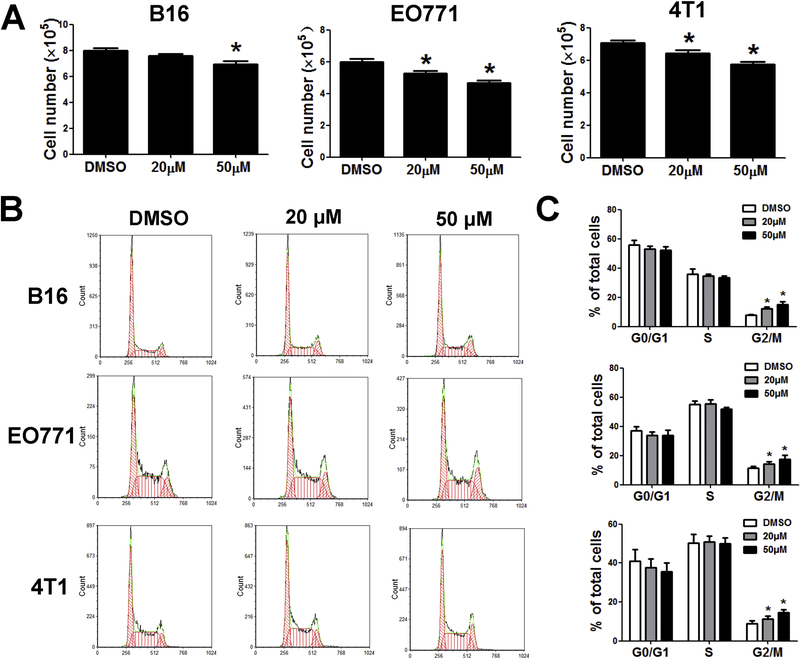
Figure 2.
Emodin suppressed cell proliferation and induced G2/M-phase arrest. (A) Relative number of cells after 24 h of 20 and 50μM emodin treatment. Living cells were counted and compared with controls. Data were presented as means ± SEM of one of three independent experiments; n=3. *p<0.05 vs Control. (B) Emodin induced G2/M-phase arrest in tumor cells. The cell cycle distribution was monitored by flow cytometry. (C) Cell cycle results as means±SEM of one of three independent experiments; n=3. *p<0.05 vs Control.

