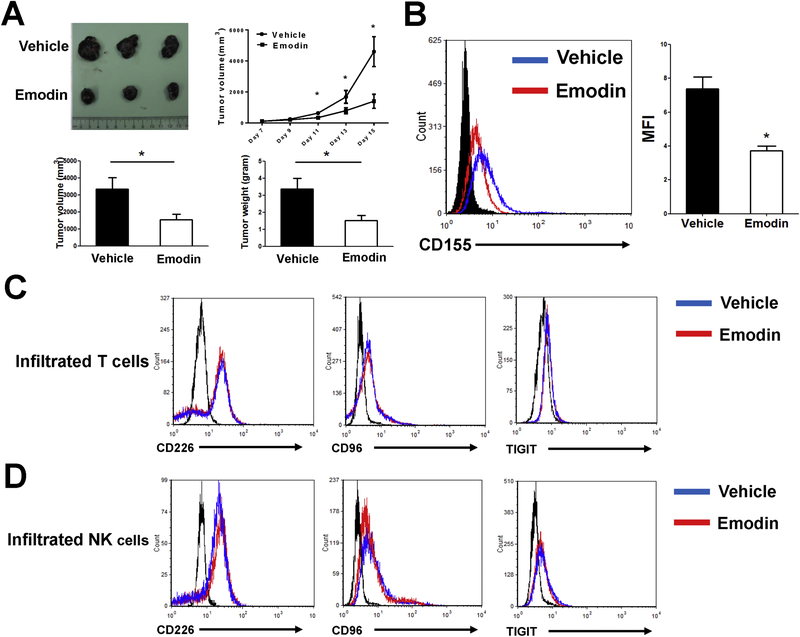
Figure 5.
Emodin decreases the expression of CD155 in tumors in vivo. (A) Emodin inhibited growth of B16-F10 melanoma. Representative tumors (upper), tumor sizes (lower left) and weights (lower right) are shown. (B) Cell surface CD155 expression in B16-F10 cells. Cancer cells were acquired from B16-F10 tumors at the experimental endpoint and measured by flow cytometry. Data were presented as means ± SEM of one of two independent experiments; n=5. *p<0.05. (C and D) Cell surface CD226, CD96 and TIGIT expression in tumor-infiltrating T cells (C) and NK cells (D) from control and emodin treatment mice were analyzed by flow cytometry. Tumor-infiltrating T cells were gated from CD3+ population, and tumor-infiltrating NK cells were gated from NK1.1+ population.

