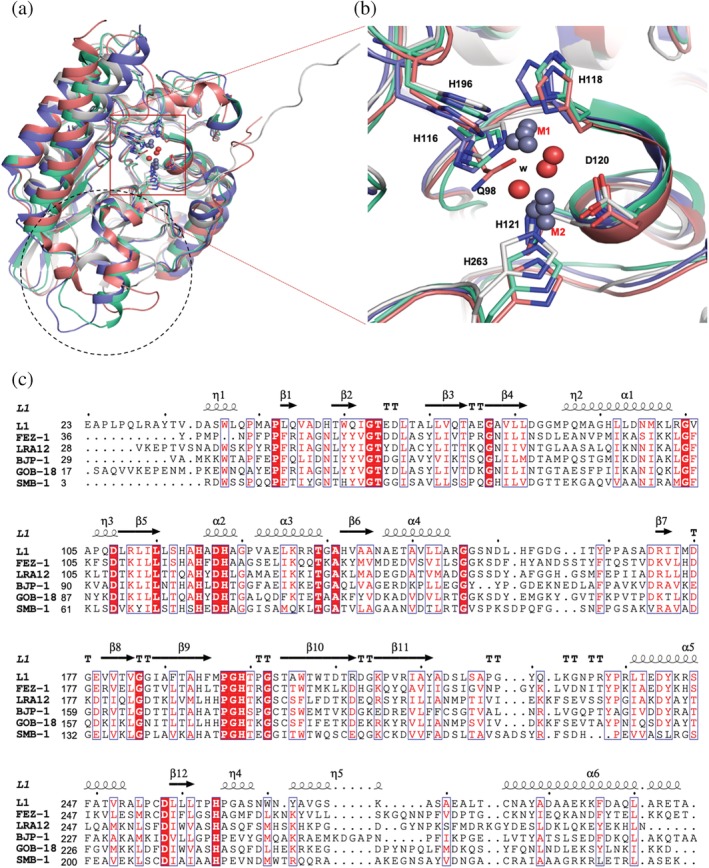
Figure 4.

Comparison of MBL B3 enzymes. Four MBL B3 structures (only for clarity), L1 (gray), FEZ‐1 (cyan), BJP‐1 (purple), and GOB‐18 (pink), are superimposed. (a) The region in the black dotted circle exhibits a structurally variable region and the red square box shows the well‐conserved di‐nuclear zinc site. (b) The close‐up view of the di‐nuclear zinc sites, red square box in (a). GOB‐18 (pink) has Gln82 in place of H105 (L1). (c) The structure‐based sequence alignment of MBL B3 proteins
