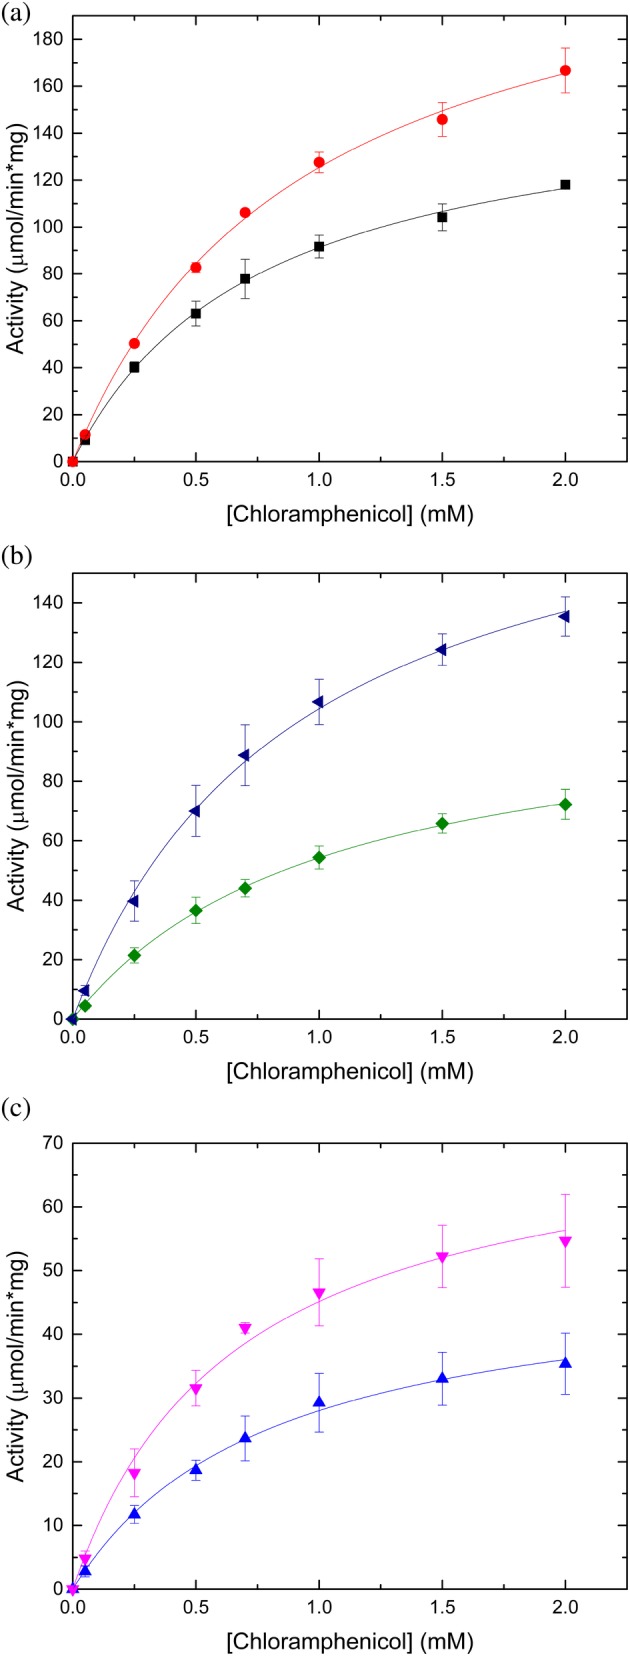
Figure 5.

Substrate saturation curves of VcCAT, VvCAT, and AfCAT toward chloramphenicol. All three proteins were kinetically characterized in the presence and absence of the N‐terminal polyhistidine affinity tag; see the Materials and Methods section for more details. (a) VcCAT in the presence (black squares) and absence of tag (red circles). (b). VvCAT in the presence (green diamonds) and absence of tag (blue triangles). (c) AfCAT in the presence (blue triangles) and absence of tag (pink triangles). Figures were prepared using Origin 2016 software
