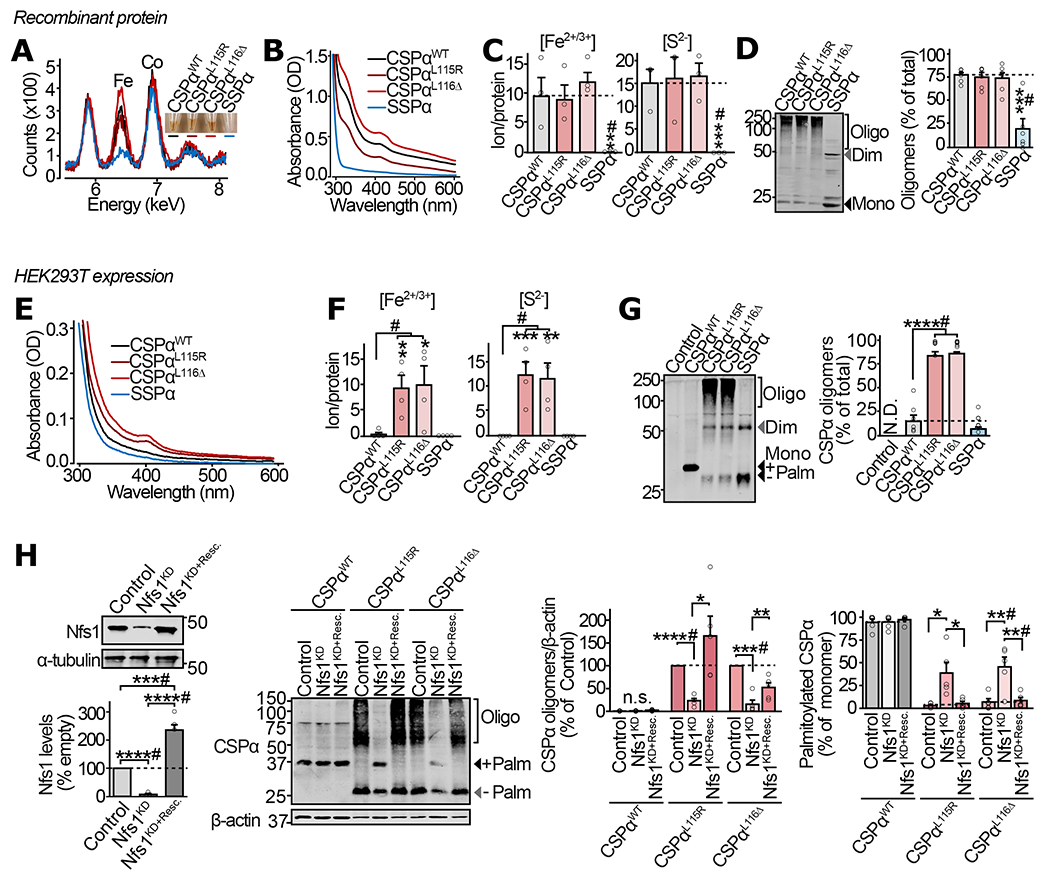
Figure 1 |. Fe-S cluster binding and oligomerization of CSPα in vitro and in mammalian cells.

(a-d) From purified recombinant proteins: (a) Color of purified CSPαWT, CSPαL115R, CSPαL116Δ, and SSPα (inset), and detection of Fe in these protein solutions by X-ray fluorescence. (b) UV-Vis absorbance spectra of the indicated versions of the purified CSPα protein. (c) Fe2+/3+ ion content, measured in indicated protein by ferrozine colorimetry (left), and S2− content measured by methylene blue colorimetry (right). (d) Oligomerization of the indicated protein measured by SDS-PAGE separation and quantitative immunoblotting against CSPα (left), shown as % of total protein in each lane (right). (e-h) From HEK293T cells expressing myc-tagged CSPαWT, CSPαL115R, CSPαL116Δ and SSPα: (e) UV-Vis absorbance spectra of indicated proteins immunoprecipitated using anti-myc antibody and eluted by trypsinization. (f) Fe2+/3+ ion content (left) and S2− content (right), measured as in (c), on the indicated protein immunoprecipitated and eluted as in (e). (g) Oligomerization of indicated CSPα variants was measured by SDS-PAGE separation and quantitative immunoblotting against CSPα. Representative immunoblot (left), and quantitation as % of the total protein detected in corresponding lane (right); Control = empty plasmid; N.D. = not detected. (h) Oligomerization and palmitoylation of CSPα variants, with Nfs1 knockdown (Nfs1KD), and rescue of knockdown by overexpression of shRNA-resistant Nfs1 (Nfs1KD+Resc.). In (d, g-h), Mono = monomer; Dim = dimer; Oligo = oligomers of higher mass than dimer; Palm = palmitoylated. Data are from (a) representative synchrotron measurement from n=3, (b) representative from n=4 , (c) n=3, and (d) n=6, where n is independent protein-purification; (e) representative from n=3 immunoprecipitations, (f) n=4 immunoprecipitations, (g) n=6 transfections, and (h) n=5 transfections. In (c-d) and (f-h) data represent means ± SEM. *P<0.05; **P<0.01; ***P<0.001; ****P<0.0001 by two-tailed Student’s t-test. #P<0.05 by Mann-Whitney-Wilcoxon U test. Uncropped blots are shown in Source Data Fig 1.
