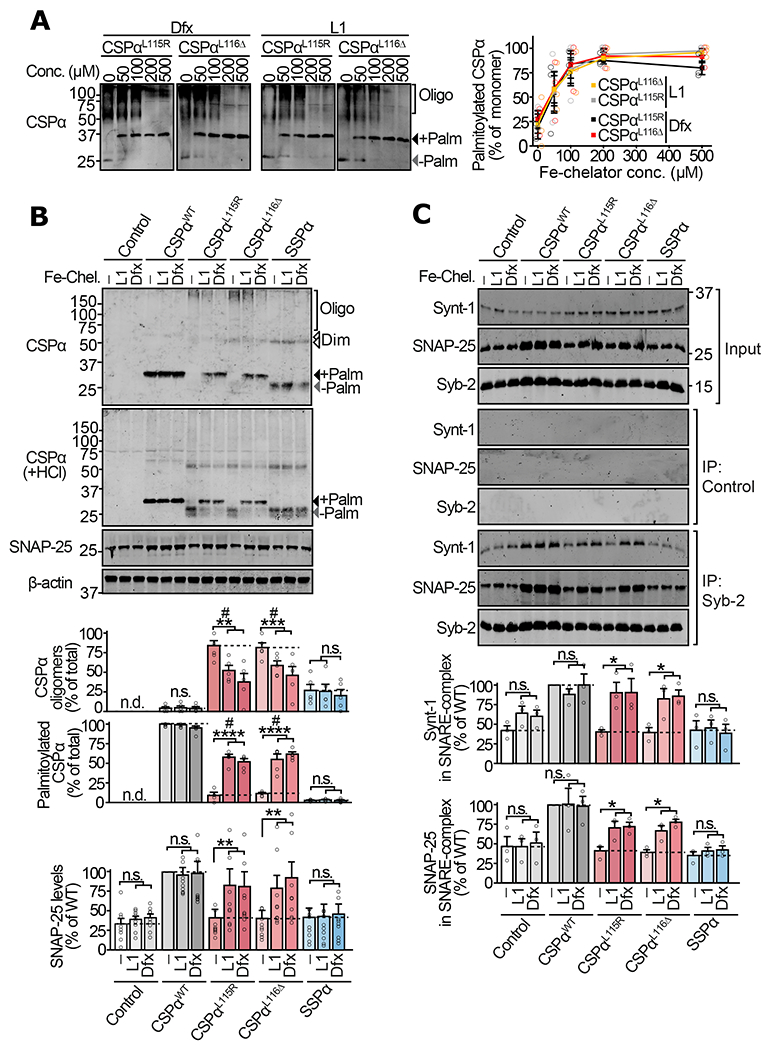
Figure 4 |. Iron-chelation in neurons alleviates oligomerization of mutant CSPα and the downstream SNARE defects.

Primary cortical neurons from neonatal CSPα−/− mice were infected with lentiviruses expressing the indicated versions of CSPα on day 5 in vitro. On day 12 in vitro, these neurons were incubated with vehicle (DMSO), or iron chelators deferiprone (L1) and deferoxamine (Dfx) for 72 hours. (a) Neurons expressing myc-tagged CSPαL115R and CSPαL116Δ were treated with indicated concentrations of L1 or Dfx, and lysates were immunoblotted for CSPα. +Palm = palmitoylated; −Palm = non-palmitoylated; Oligo = oligomers. (b) Neurons expressing myc-tagged CSPαWT, CSPαL115R, CSPαL116Δ, SSPα, or empty virus (Control) were treated with DMSO vehicle (−), L1 (200 μM), or Dfx (200 μM). Oligomerization was measured by SDS-PAGE separation and quantitative immunoblotting against CSPα. Palm = palmitoylated; Dim = dimer; Oligo = oligomers of higher mass than dimer. To measure palmitoylation, oligomers were disrupted by lysing neurons in 0.1 N HCl plus 0.1% Triton X-100 for 20 min at 4 °C, followed by SDS-PAGE and quantitative immunoblotting against CSPα. SNAP-25 levels were measured from total lysate by quantitative immunoblotting against SNAP-25, normalized to β-actin. (c) Synaptic SNARE-complex assembly was measured by co-immunoprecipitation (co-IP) experiment. Syb-2 IP was followed by quantitative immunoblotting of co-IP’d SNAP-25 and Synt-1, each normalized to the IP’d Syb-2. Control = sham IP with plain rabbit serum. Data are from (a) n=3 transductions, (b) n=5 for CSPα oligomerization and palmitoylation, and n=10 for SNAP-25 levels (n = transduction plus treatment), and (c) n=3 Syb-2 immunoprecipitations. Data represent means ± SEM. For (a) P<0.05 for both CSPα variants at >100 μM compared 0 μM. For (b-c) *P<0.05; **P<0.01; ***P<0.001; ****P<0.0001 by two-tailed Student’s t-test. #P<0.05 by Mann-Whitney-Wilcoxon U test. n.s. = not significant; n.d. = not detected. Uncropped blots are shown in Source Data Fig 4.
