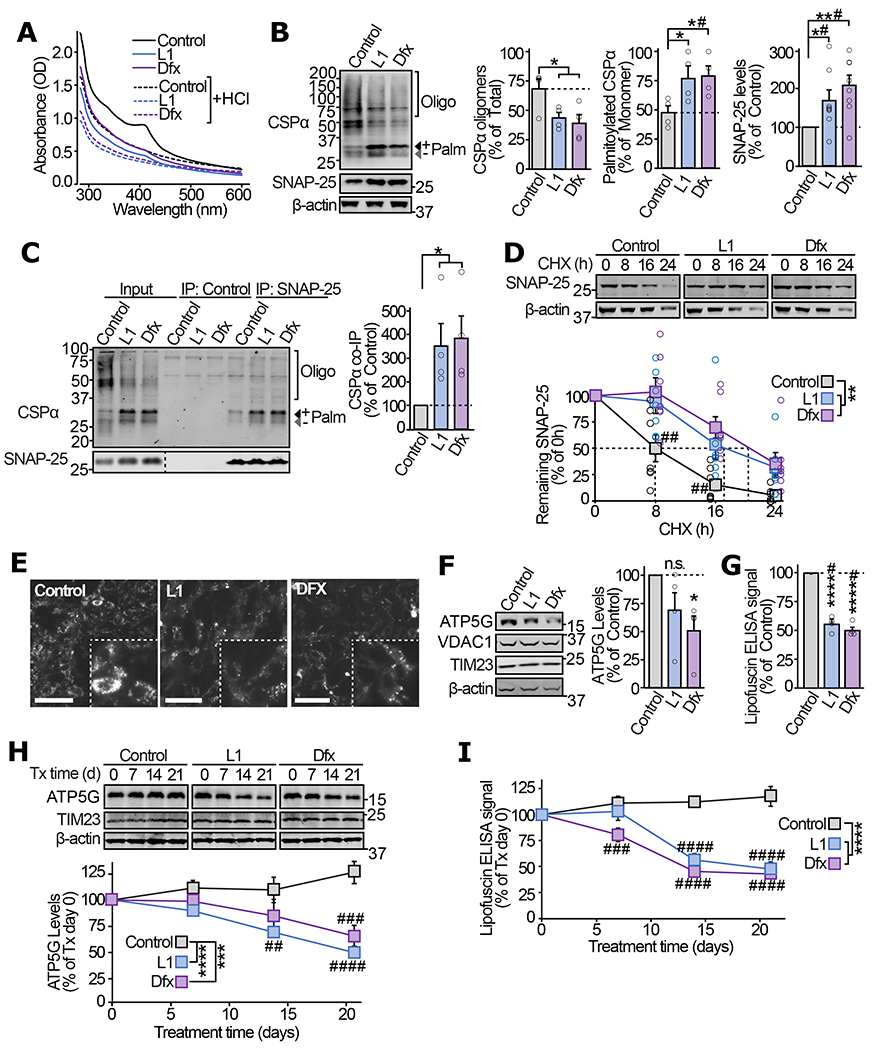
Figure 5 |. In ANCL patient-derived iNs iron-chelators alleviate CSPα oligomerization, the SNAP-25 chaperoning defect, and lipofuscin accumulation.

(a) ANCL patient-derived fibroblasts were treated with 200μM of L1 or Dfx, or 0.1% DMSO (Control) for 72 h. UV-Vis absorbance spectra of immunoprecipitated CSPα were measured before and after HCl treatment. (b-d) In ANCL iNs treated with L1, Dfx, or vehicle for 72 h following the iN conversion: (b) levels of oligomerized and fully palmitoylated CSPα as well as total SNAP-25 were measured by quantitative immunoblotting. Oligo = oligomers; Palm = palmitoylated. (c) The interaction of CSPα with SNAP-25 was measured by immunoprecipitating SNAP-25 followed by quantitative immunoblotting of co-immunoprecipitated CSPα (normalized to SNAP-25 IP). Control = IP without IgG. (d) Turnover of SNAP-25 was determined by cycloheximide chase, while maintaining the iron-chelators or vehicle in the medium. (e-g) ANCL iNs treated with L1, Dfx, or vehicle for 56 d were analyzed for (e) lipofuscin autofluorescence (Ex 465-495, Em 515-555 nm; scale bar = 50 μm), (f) ATP5G levels by quantitative immunoblotting (VDAC1 and TIM23 indicate overall mitochondrial protein expression), and (g) lipofuscin accumulation by ELISA. (h-i) 56 day old untreated ANCL iNs were treated with L1, Dfx, or vehicle, and analyzed for (h) ATP5G levels by quantitative immunoblotting and (i) lipofuscin by ELISA, at indicated days of treatment. Data are from (a) representative of n=4, (b) n=4 for CSPα oligomerization and palmitoylation, and n=8 for SNAP-25 levels, (c) n=4, (d) n=7, (e) representative of n=3, (f) n=4, (g) n=4, (h) n=6, (i) n=3. In (a, c) n = immunoprecipitation; in (b, d-i) n = iN conversions. Data in (b-d, f-i) represent means ± SEM. In (b-c, f-g) *P<0.05; **P<0.01; ****P<0.0001 by two-tailed Student’s t-test. #P<0.05 by Mann-Whitney-Wilcoxon U test. In (d, h-i) **P < 0.01; ***P<0.001; ****P<0.0001 by two-way ANOVA; ##P<0.01; ###P<0.001; ####P<0.0001 by Tukey’s multiple comparisons test. Uncropped blots are shown in Source Data Fig 5.
