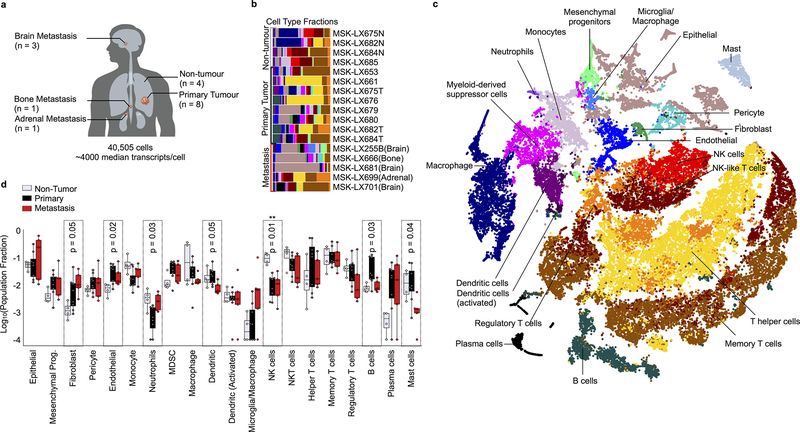
Figure 1. The single-cell transcriptional landscape of human lung adenocarcinoma.
a, Patient tissues profiled (metadata summarized in Extended Data Fig. 1). b, Cell type fractions detected per sample, color coded as in c. c, t-SNE projection of the complete atlas of normal lung, primary tumour and metastatic LUAD colored by cell type; includes carcinoma and non-tumour epithelium, as well as immune and other stromal cell types within the tumours (n = 40,505 cells). d, Cell-type abundances differ between normal, primary and metastatic sites (n = 17 patient samples; center line, median; box limits, upper and lower quartiles; whiskers, 1.5x interquartile range; points, outliers). Significant differences in cell type abundance are highlighted (Kruskal-Wallis rank test).

