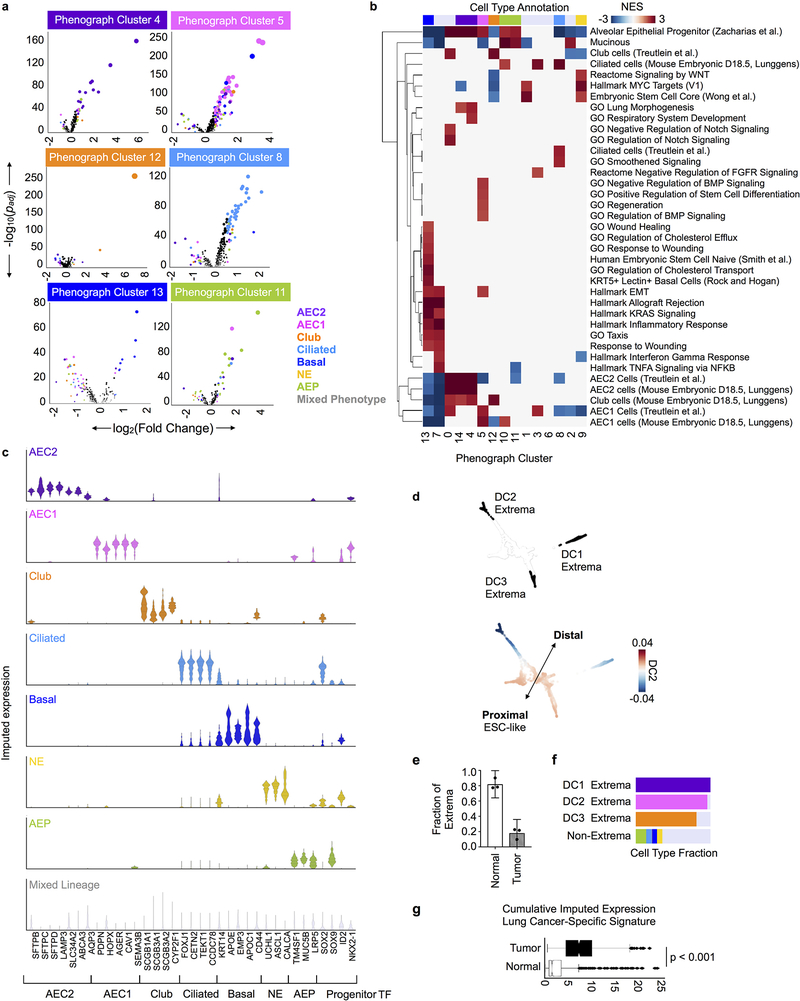
Extended Data Fig. 7: The relationship between primary tumor and normal lung epithelial cell types.
a, Top DEGs per Phenograph Clusters annotated in Fig. 2b, compared to all other cells, computed using MAST44. Each lineage-specific gene is colored by associated cell type, with diameter proportional to −log10(padj). See Supplementary Table 1 for lineage-specific genes. b, Clustered heatmap of gene signatures differentially enriched (abs(NES) > 2 and padj < 0.05) in one or more Phenograph Clusters. NES, Normalized Enrichment Score. Column colors (top) correspond to annotated epithelial lineages. Signatures not meeting these criteria are whited out. See Supplementary Table 8 for complete GSEA results per Phenograph Cluster. c, Violin plots showing imputed expression of canonical lineage-specific transcription factors (columns) for each annotated epithelial cell lineage (color), scaled such that each plot has the same width; lines distinguish data quartiles. d, Force-directed layout of all epithelia (n = 2,140 cells) colored by extrema of the three most informative diffusion components (DCs, above) and by DC2 (below); GSEA of cells ranked along DC2 are positively enriched for embryonic stem cell gene signatures and pathways associated with proximal cell types, and negatively associated distal cell types. Complete GSEA results are provided in Supplementary Table 8. e, Fraction of normal- and primary tumor- derived cells comprising the union of all three DC extrema (center values, mean; error bars, 95% confidence interval; points, fraction of cells measured at n = 3 diffusion extrema). f, Fraction of each annotated cell type detected per diffusion component extrema and in non-extrema. g, Cumulative imputed expression of a bulk-derived gene signature up-regulated in LUAD and not expressed in non-cancerous epithelium30 evaluated per cell in normal vs. tumor-derived epithelium (center line, median; box limits, upper and lower quartiles; whiskers, 1.5x interquartile range; points, n = 2,140 individual cells); two-sided p < 0.001, Mann Whitney U test.

