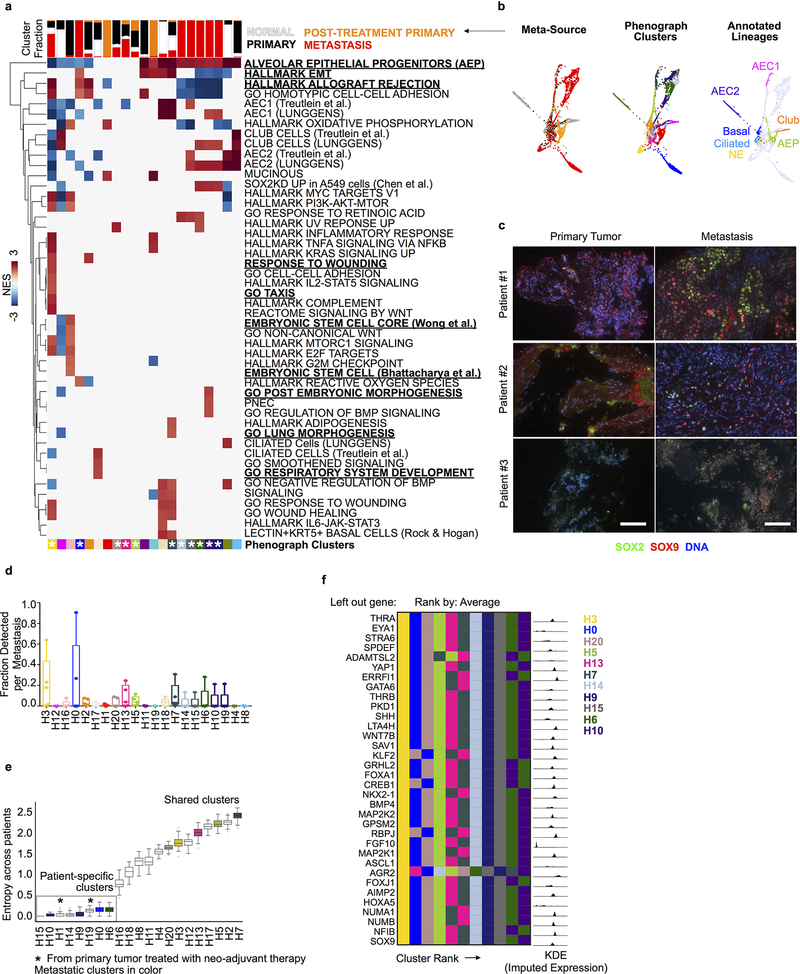
Extended Data Fig. 8: Identification of transcriptionally distinct metastatic subpopulations.
All data in this figure relates to the combined normal, primary tumor and metastatic epithelium. a, Clustered heatmap showing gene signatures differentially expressed across Phenograph clusters. Normalized enrichment score (NES) is colored for gene signatures in which abs(NES) > 1.5 and two-sided padj < 0.05. padj, Bonferroni corrected, two-sided p-value. Rows correspond to gene signatures, column corresponds to Phenograph clusters. See Supplementary Table 10 for complete GSEA results per cluster. Fraction of each Phenograph cluster derived per tissue source is visualized above each column. White stars (bottom) denote patient metastatic clusters based on fraction of metastatic cells (>10%). (b) Tissue source, clusters (matching those depicted in a), and cell types (annotated as in Fig. 2), are visualized on a force directed layout (n = 3,786 cells). c, SOX2, SOX9 and DAPI immunofluorescence in three additional patient-matched primary tumor-metastasis pairs. Scale bars, 100 μm. d, Fraction of each Phenograph cluster detected per metastasis sample (center line, median; box limits, upper and lower quartiles; whiskers, 1.5x interquartile range; points, fraction detected per n = 5 metastatic samples). e, Entropy of patient distribution in each cluster, computed with bootstrapping to correct for number of cells per cluster (center line, median; box limits, upper and lower quartiles; whiskers, 1.5x interquartile range, n = 100 random subsamples of data). Metastatic clusters are shaded by Phenograph cluster ID and clusters are ordered by average entropy. Metastatic clusters associated with alveolar epithelial progenitor signature (type III), and two clusters comprised predominantly of primary tumor cells treated with neo-adjuvant therapy are patient-specific. f, Left, Patient metastatic clusters ranked according to average lung epithelial development GO signature expression (n = 34 genes) less one gene. Each row shows metastatic cluster ranking for each left-out gene. Right, kernel density plot of imputed and normalized expression of each left-out gene.

