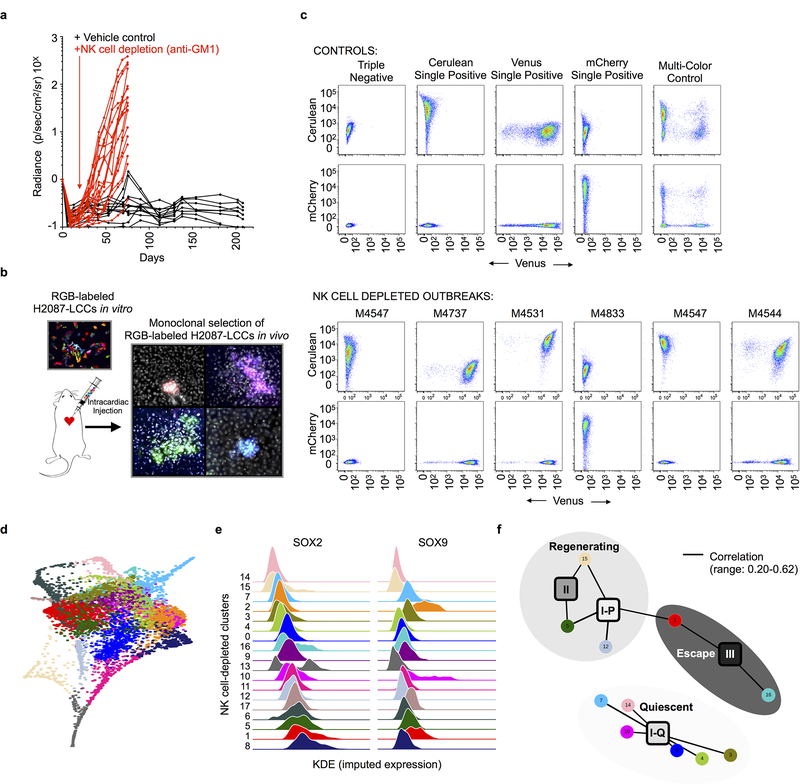
Extended Data Fig. 10: Clonality and phenotypic landscape of NK cell-depleted macrometastases.
a, Integrated radiance of H2087-LCC cells intracardially injected in mice, +/− anti-GM1 antibody treatment to deplete NK cells measured over time. b, Schematic illustrating trichromatic marking system implemented to assay the clonality of NK cell-depleted metastases. Fluorescence of trichromic reporter visualized in metastatic outbreaks generated in NSG mice lacking NK cells. c, FACS plots shows distribution of cells expressing Cerulean, Venus and mCherry per NK cell-depleted metastasis (lower) as compared to single and multi-color controls (upper); repeated independently for n = 6 NK cell-depleted macrometastases. d, Force-directed layout of all single cells (n = 6,073 cells) transcriptionally profiled from 8 NK cell-depleted macrometastases colored by Phenograph cluster. e, Kernel density plot of the imputed expression of SOX2 and SOX9 in each NK cell-depleted Phenograph cluster; clusters are ranked by median of the SOX2 distribution. f, A bipartite graph representing genome-wide correlations across all common, variably expressed genes (n = 2,895; Methods) between each NK cell-depleted Phenograph cluster (n = 18,circular nodes) and each developmental state observed in human tumors (n = 4, square nodes, annotated in Fig. 3c). The Pearson correlation is computed across all categorical assignments between the two independent sets and edges link NK cell-depleted Phenograph clusters to human developmental for Pearson R > 0.20 and two-sided p < 0.05; edge width is scaled by the magnitude of the correlation (observed range: 0.20–0.62). Pearson correlation coefficients are also reported in Supplementary Table 2. Shading is used to highlight nodes assigned the three metastatic states detailed in Fig. 4.

