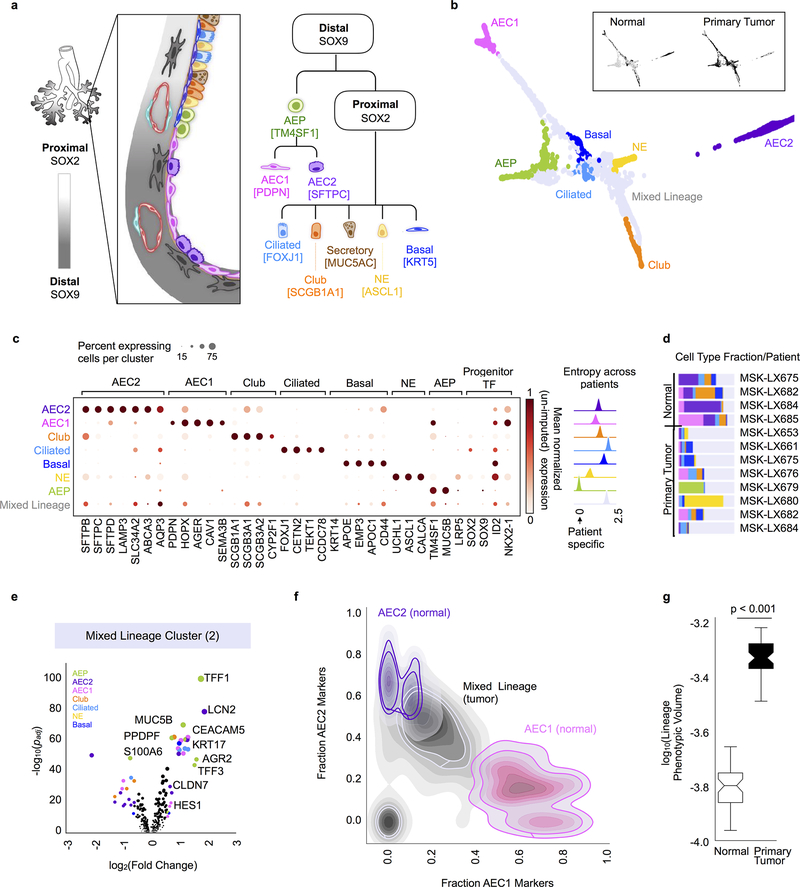
Figure 2. Regenerative and mixed lineages in primary tumours.
a, Key epithelial cell types and associated transcription factors (in brackets) implicated in lung development and regeneration29. Specialized cell types of the SOX9-specified distal lung include type I alveolar epithelial cells (AEC1) that perform gas exchange, and type II alveolar epithelial cells (AEC2) that secrete surfactants. The SOX2-specified proximal upper airway includes secretory, neuroendocrine (NE) and ciliated cell types that predominantly serve barrier functions. Infiltrating stromal cell types that support lung epithelial development and are detected by scRNA-seq are also illustrated. b, Force-directed layout of normal and primary tumour epithelial cells colored by annotated lineage (n = 2,140 cells). Tumour cells that concomitantly express multiple cell type markers (mixed lineage) are in grey. Inset, same layout colored (in black) by source of epithelium. c, Left, Relative frequency of cells expressing each canonical lineage marker (any counts detected in un-imputed data) and the average un-imputed expression of each gene (z-normalized across epithelial cell types) for all expressing cells in a given cluster. Right, Kernel density plot depicting entropy of cell mixing across all patients for each cell type, computed with bootstrapping to correct for number of cells in each cluster (n = 100 random subsamples of data). High entropy indicates most similar cells come from a well-mixed set of patient samples; low entropy indicates most similar cells come from the same patient sample. d, Fraction of each cell type detected per patient sample (colors as in b). e, Top DEGs for a representative mixed lineage cluster (Cluster 2, n = 183 cells) compared to all other cells computed using MAST44, indicating enrichment of AEC1, AEC2, club, ciliated, basal and AEP markers (volcano plots supporting other mixed-lineage clusters are in Extended Data Fig. 7a). Lineage-specific DEGs are colored by associated cell type (as in b), diameter proportional to −log10(padj) for genes with fold change > 1.5 and padj < 0.05 (see Supplementary Table 1 for lineage-specific genes). f, 2D cell density plot showing fraction of AEC1 and AEC2 lineage markers per cell in normal lung alveolar cells compared to tumour cells from Clusters 0 and 1. Only markers with normalized un-imputed expression in the top quartile (per gene, across all cells) are plotted. The overlapping distributions are shaded by cell type. g, Lineage phenotypic volume (Methods) of epithelium derived from primary tumours compared to normal lung, showing significant expansion of lineage gene-gene covariate structure in primary tumours (two-sided Mann-Whitney rank test, p < 0.001). n = 50 random subsamples of the data each (center line, median; box limits, upper and lower quartiles; whiskers, 1.5x interquartile range; points, outliers).

