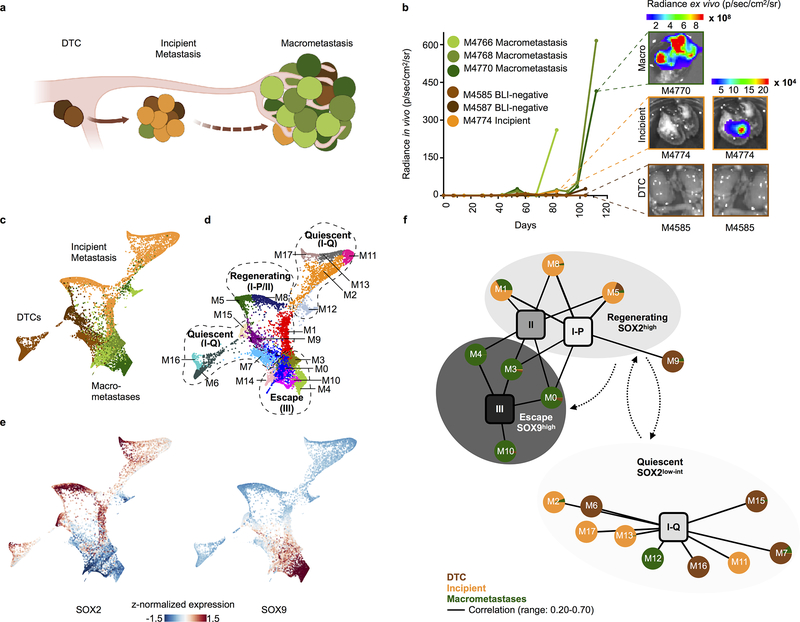
Figure 4. Developmental continuum in a mouse model of metastatic escape.
a, Xenograft model of metastatic escape, illustrating the three stages from which single cells were sampled. b, BLI growth curves (measured ex vivo for up to 120 days) for all sampled xenograft metastases, including ex vivo BLI images acquired at tissue harvest. c-d, Force-directed layout of all metastatic tumour cells (n = 8,748 cells) isolated from 6 mice colored by (c) source and (d) Phenograph cluster. Clusters were grossly assigned to one of three metastatic states: Quiescent, correlated with a non-proliferating stem-like state (type I-Q); Regenerating, correlated with proliferating stem (type I-P) and the regenerative (type II) state; and Escape, which is highly concordant with SOX9high alveolar epithelial progenitors (type III) (see Methods). e, Force-directed layout (as in c,d) of all xenograft tumour cells colored by imputed, z-normalized SOX2 and SOX9 expression. f, Bipartite graph representing genome-wide correlations across all common, variably expressed genes (n = 2,096, Methods) between the 18 mouse clusters (circular nodes) and 4 developmental human tumour states (square nodes, annotated in Fig. 3c). Pie charts within circular nodes represent mouse cell sources. Edges link mouse clusters and human states with genome-wide Pearson R > 0.20 and two-sided p < 0.05; edge width is proportional to the correlation magnitude (see Supplementary Table 2 for exact values). Dotted arrows suggest temporal ordering between metastatic states, based on the three stages from which cells were isolated and profiled (according to BLI signature).

