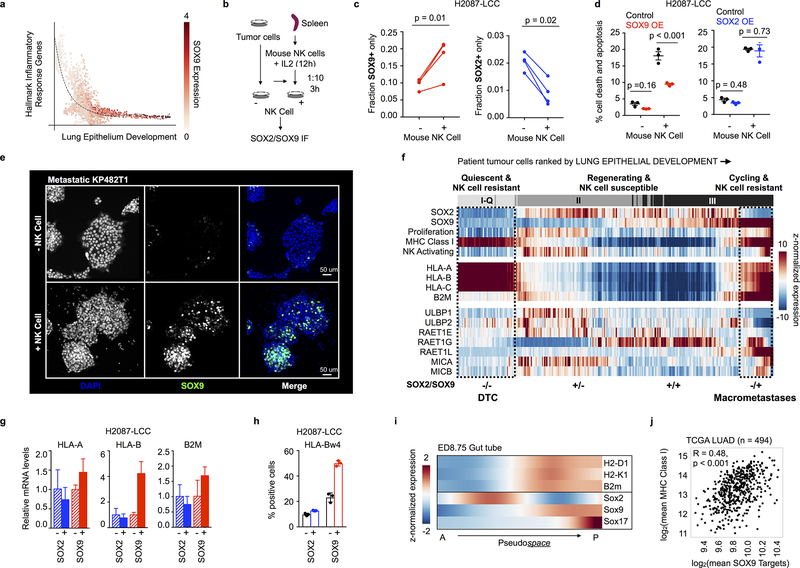
Figure 5. Developmental stage-specific differential immune sensitivity.
a, Average imputed and normalized Hallmark Inflammatory Response gene expression (Supplementary Table 2) across all patient-derived tumour cells, ranked by average lung epithelial development score. Each dot represents a cell colored by its imputed and normalized SOX9 transcript counts. b, NK cell co-culture assay. Tumour cells were cultured alone or with IL2-activated mouse NK cells at a 1:10 ratio for 3 h, and endogenous SOX2 and SOX9 were detected by immunofluorescence (IF). c, Fraction of H2087-LCC cells exclusively positive for either nuclear SOX9 or SOX2 before and after co-culture (average of 3 technical replicates for each of 4 independent experiments; paired two-sided t-tests, 3 degrees of freedom). A total of 134,946 cells before co-culture and 32,602 cells after co-culture were quantified. d, Percentage of cell death and apoptosis in H2087-LCC cells measured by flow cytometry before and after co-culture in the context of inducible SOX2 and SOX9 over-expression (center line, mean; whiskers, SEM; points, 3 independent experiments; unpaired two-sided t-test, 8 degrees of freedom). e, SOX9 IF in KP482T1 mouse metastatic tumour cells before and after 3-h co-culture of tumour and IL2-activated mouse NK cells at a ratio of 1:10 (repeated in 3 independent experiments with similar results). f, Expression of transcription factors specifying stem and lung epithelial progenitors, MHC Class I markers of self, and NK activating ligands across patient-derived tumour cells assigned to type I-Q, II or III developmental stages (top row, as in Fig. 3), in patient primary tumours and metastases. Proliferation refers to mean PCNA, MKI67 and MCM2 expression per cell. MHC Class I and NK activating show the average expression of their associated genes, visualized individually below. For each gene, imputed expression was z-normalized across all cells and smoothed using a 20-cell moving average widow. Dashed boxes indicate association with spontaneous micro- or macro-metastases observed in our xenograft model. Bottom, SOX2/SOX9 status. g, Relative expression of MHC Class I genes important for NK cell evasion in H2087-LCC cells with and without SOX2 or SOX9 induction, measured by RT-PCR (n = 3 technical replicates; center values, mean; error bars, 95% confidence interval). h, Cells positive for HLA Class I Bw4 surface protein, measured by flow cytometry (n = 3 independent experiments; center values, mean; error bars, 95% confidence interval; points, all measured data). i, Imputed expression of MHC Class I markers of self and Sox transcription factors specifying stem and lung epithelial progenitors in the D8.75 mouse gut tube, showing spatial segregation of Sox2 and Sox9 lineages in cells ranked by their pseudospace ordering45. A, anterior; P, posterior. j, Correlation between average SOX9 target gene expression, predicted using motifs from the JASPAR Predicted Transcription Factor targets dataset (Supplementary Table 2)46,47 and the average expression of all MHC Class I genes across n = 510 TCGA LUAD patients (Pearson R = 0.48 and two-sided p < 0.001 to test for non-correlation). Outliers defined as 1.5X the interquartile range less than Q1 or greater than Q3 (n = 16) are removed from the scatter plot.

