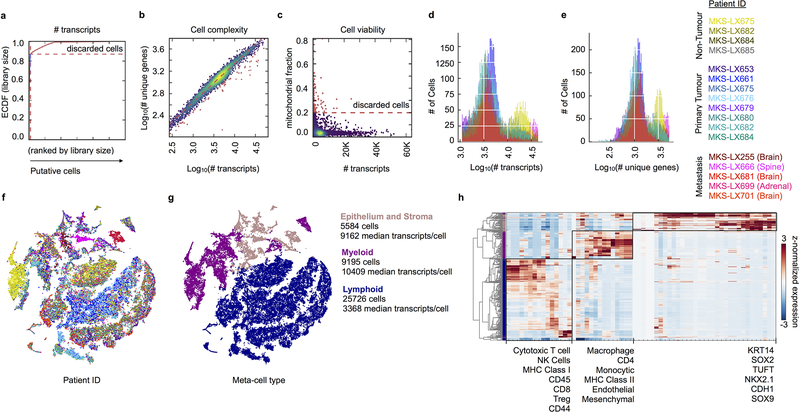
Extended Data Fig. 2: Single cell parameters and pre-processing.
Cells were filtered based on (a) cumulative number of transcript counts, (b) cell complexity and (c) fraction of mitochondrial mRNA content detected per cell as described in the Methods; shown here for one representative library. Excluded cells are labeled in red. Histograms showing the distribution of (d) total number of transcripts detected per cell and (e) number of unique genes detected per cell in retained cells colored by sample. f-h, t-SNE projection of the complete atlas of normal lung, primary tumor and metastatic LUAD (same projection as Figure 1c, n = 40,505 cells), cells colored by (f) sample and (g) meta-cell class as determined by (h) unsupervised clustering of canonical gene signatures within each meta-cell class across all cells. Clustering of canonical cell type expression signatures (annotated in Supplementary Table 2), z-score normalized per gene across cells. Assignment to meta-cell classes (detailed in Methods) are colored on the dendrogram.

