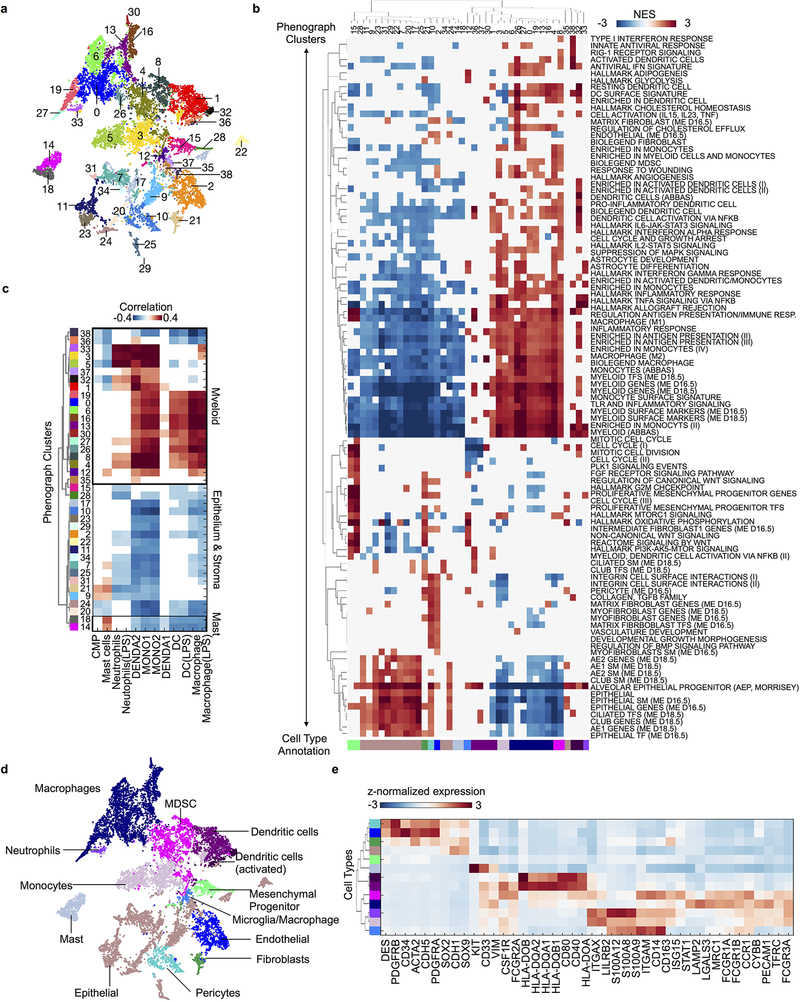
Extended Data Fig. 3: Phenotyping myeloid, epithelial and stromal cell types.
a, t-SNE projection of myeloid, epithelial and stromal cells (purple and tan populations from Extended Data Fig. 2g, n = 9,195 cells) colored and labeled by their Phenograph cluster assignment (Phenograph run on subset as detailed in Methods). b, Heatmap of gene signatures differentially expressed by Phenograph clusters with abs(NES) > 2 and padj < 0.05, clustered (rows and columns) according to the cosine distance metric for visualization; hits not meeting these criteria are whited out. Numbered by Phenograph clusters (top) and colored by inferred cell type assignments (bottom, see Methods). NES, normalized enrichment score; padj, Bonferroni corrected, two-sided p-value. c, Pearson correlations between Phenograph cluster centroids and bulk mRNA profiles from purified immune subpopulations56,57 (n = 5,987 genes, Methods). Correlation coefficients are whited out if p > 0.01 for the Pearson test for non-correlation. d, t-SNE projection of all myeloid/epithelial/stromal cells (same as a) colored and labeled by inferred cell types. Phenograph clusters were mapped to cell types using (b-c) and are directly mapped back to the complete patient dataset in (Fig. 1c) using the same color scheme. e, Clustered heatmap of the average imputed expression per cell type of distinguishing markers, standardized by z-score. Rows are colored by annotated cell type.

