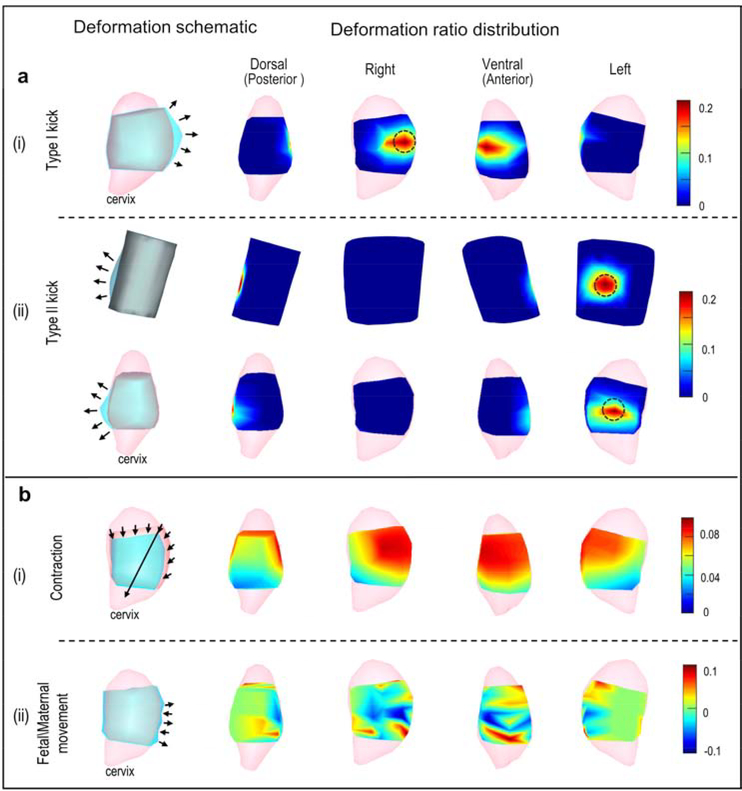
Figure 2. Simulation of geometrical deformations.
a, Local deformations. b, Global deformations. All rows show the uterus except the top row in a(ii), which shows the body surface. Note that the body surface is not to scale with the uterus in the other rows. In each row, the left-most image shows a schematic of the simulated deformation. Light pink, complete uterine surface; blue, deformed surface; light gray, original uterine surface overlap of blue and dark pink (as in Figure 1); dark gray, overlap of blue and beige body surface color (as in Figure 1). Arrows indicate the deformation region and direction. In each row, the four images on the right show deformation ratios in heat maps from the four indicated views. Warm colors indicate large deformations, and cool colors indicate small deformations as indicated in scales at far right. Black circles mark regions with maximum deformation ratios for local deformations.

