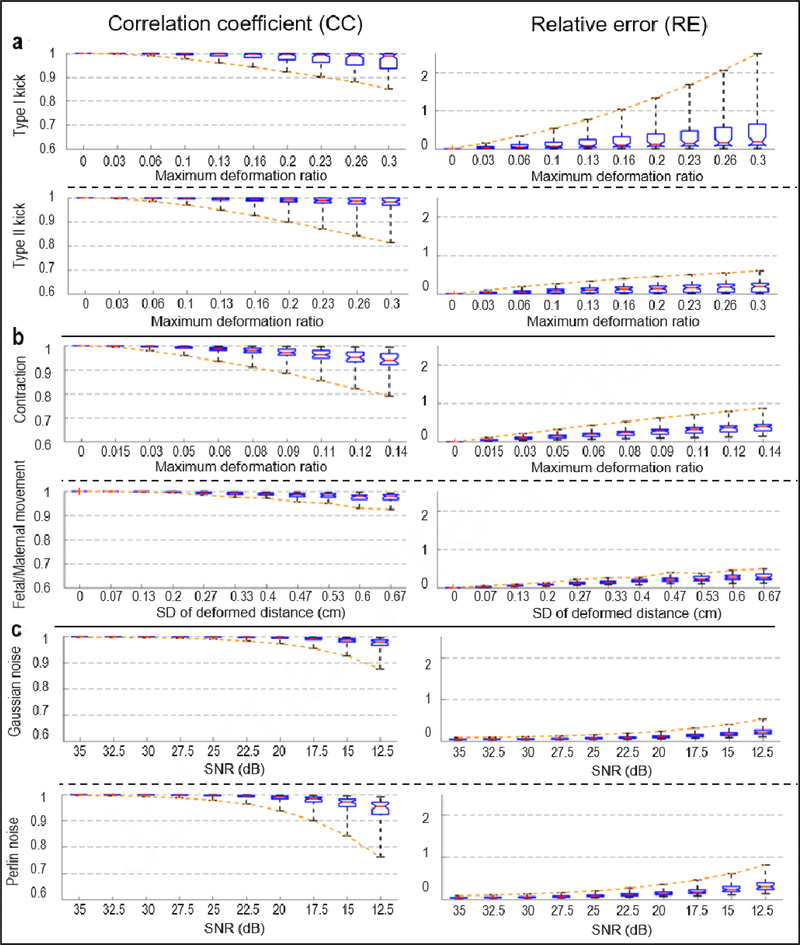
Figure 5. EMMI-reconstructed electrogram errors under different extents of deformation or noise.
Results are summarized with standard box plots indicating median (red line), 1st and 3rd quartile (boxes), and minimum and maximum values (whiskers). Orange dashed lines connect the minimum CC or maximum RE values, indicating the largest errors at different deformation ratios or SNR. a, Local deformations (n=55), b, Global deformations n=55 for contraction, n=31 for fetal/maternal movement), c, Signal noise (n=55).

