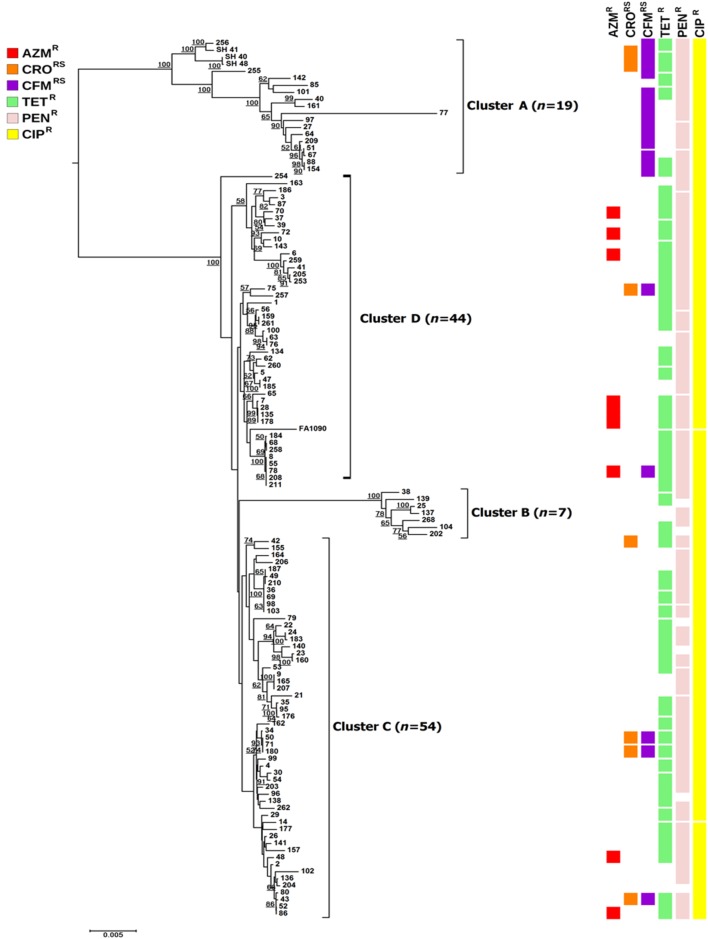
Figure 1.
Phylogenetic analysis based on the seven loci for NG-STAR. The phylogenetic tree was constructed using MEGA 6 software. Horizontal lines are proportional to phylogenetic distance. Resistance phenotypes are shown as coloured squares for each isolate and each square represents one isolate. Numbers on the tips are N. gonorrhoeae isolate numbers. Bootstrap values of ≥50 are shown at the nodes of the tree branches. Four clusters (clusters A–D) are defined arbitrarily. AZMR, azithromycin resistance; CRORS, reduced susceptibility to ceftriaxone; CFMRS, reduced susceptibility to cefixime; TETR, tetracycline resistance; PENR, penicillin resistance; CIPR, ciprofloxacin resistance.

