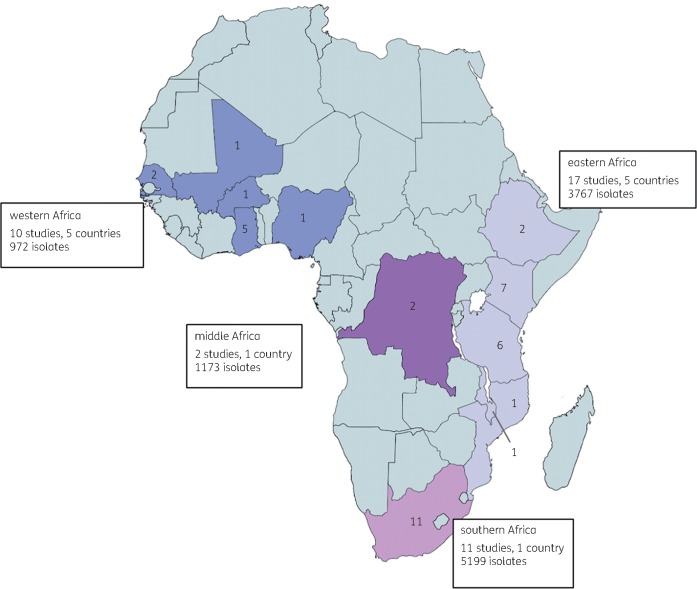
Figure 2.
Geographical location of studies reporting proportions of 3GC resistance amongst E. coli, Klebsiella spp. and NTS. Numbers in country indicate the number of studies included in the review for each country. This figure appears in colour in the online version of JAC and in black and white in the print version of JAC.

