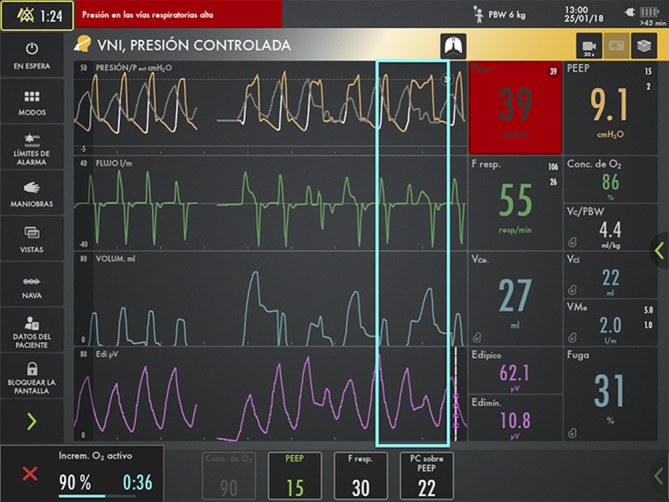
Figure 2.

Severe patient-ventilator asynchrony in the assisted/controlled pressure mode. The grey line represents the pressure curve which the patient would perform through activation of the NAVA mode and its neural trigger, while the yellow curve corresponds to the pressure controlled by the ventilator. The light bluebox highlights a period of extreme asynchrony between the theoretical NAVA mode neurally triggered (grey line) and the current Pressure control mode (yellow line), pressure triggered (white line). NAVA, neurally adjusted ventilatory assist.
