. 2019 Nov 19;8(6):1016–1027. doi: 10.1039/c9tx00179d

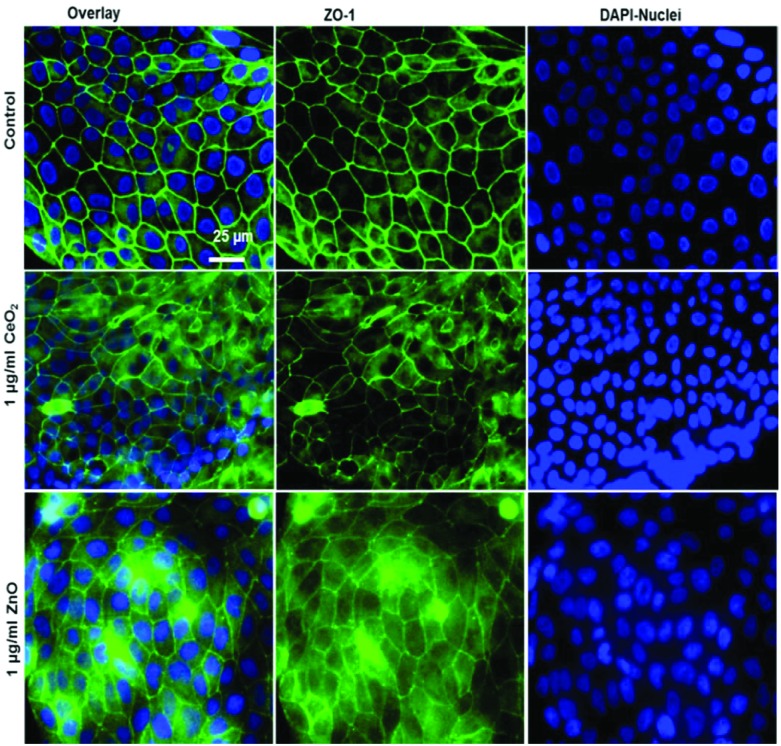
Fig. 5. Tight junction staining reveals no major effect of NPs exposure at submerged conditions to huAEC cells. The control group shown in upper row contains the overlay image of fluorescently labelled tight junction protein ZO-1 in green and nuclei in blue (DAPI) as first image, 2nd and 3rd images show ZO-1 and nuclei staining respectively. The middle row displays the overlay of ZO-1 in green and nuclei in blue after 24 h exposure to 1 μg ml–1 CeO2 NPs as first image, 2nd and 3rd images show ZO-1 and nuclei staining respectively. The lower row shows the overlay of ZO-1 in green and nuclei in blue after 24 h exposure to 1 μg ml–1 ZnO NPs as first image, 2nd and 3rd images show ZO-1 and nuclei staining respectively.

Fig. 5