. 2019 Nov 19;8(6):1016–1027. doi: 10.1039/c9tx00179d

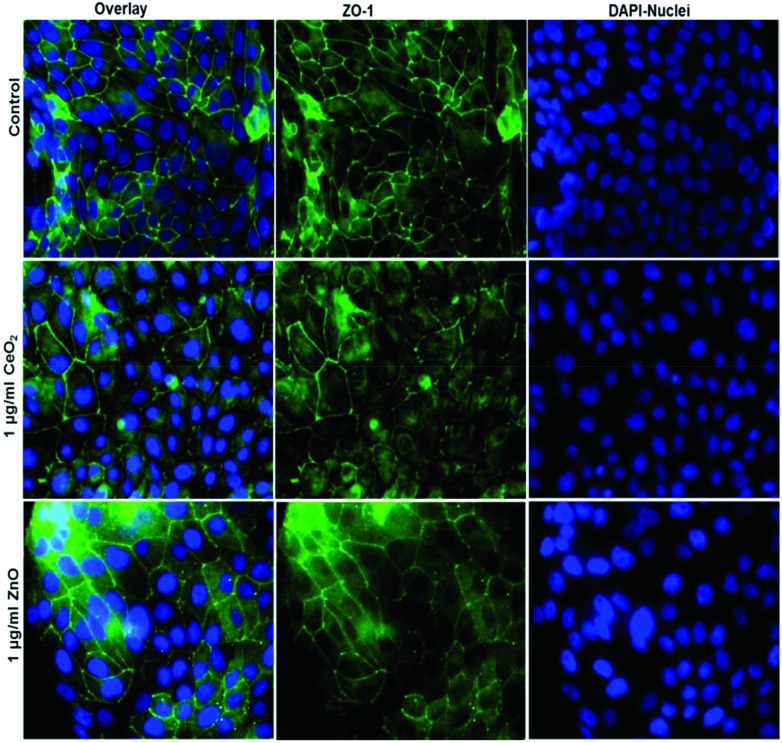
Fig. 6. Tight junction staining reveals no major effect of NPs exposure at liquid–liquid-interface (ALI) to huAEC cells The control group shown in upper row contains the overlay image of fluorescently labelled tight junction protein ZO-1 in green and nuclei in blue (DAPI) as first image, 2nd and 3rd images show ZO-1 and nuclei staining respectively. The middle row displays the overlay of ZO-1 in green and nuclei in blue after 24 h exposure to 1 μg ml–1 CeO2 NPs as first image, 2nd and 3rd images show ZO-1 and nuclei staining respectively. The lower row shows the overlay of ZO-1 in green and nuclei in blue after 24 h exposure to 1 μg ml–1 ZnO NPs as first image, 2nd and 3rd images show ZO-1 and nuclei staining respectively.

Fig. 6