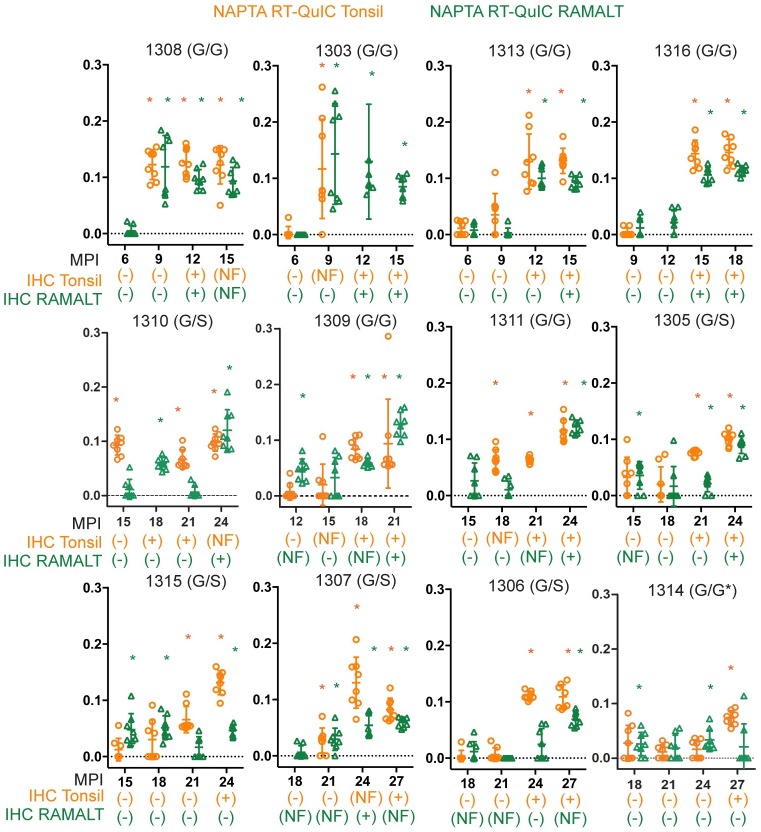
Fig 3. Comparison of IHC and NAPTA RT-QuIC detection in tonsil and RAMALT biopsies.
Each plot displays a 12-month timeframe where deer became IHC positive for the first time. Months post inoculation is on the x-axis and RT-QuIC reaction rate is displayed on the y-axis. The IHC status of each deer is displayed for tonsil and RAMALT biopsies below each timepoint as positive negative or no follicle (NF). The deer number and genotype are displayed on top of each graph. Tonsil RT-QuIC and IHC data is in orange. RAMALT RT-QuIC and IHC data is in green. RT-QuIC tests that are deemed positive by MW-test are marked with a star.

