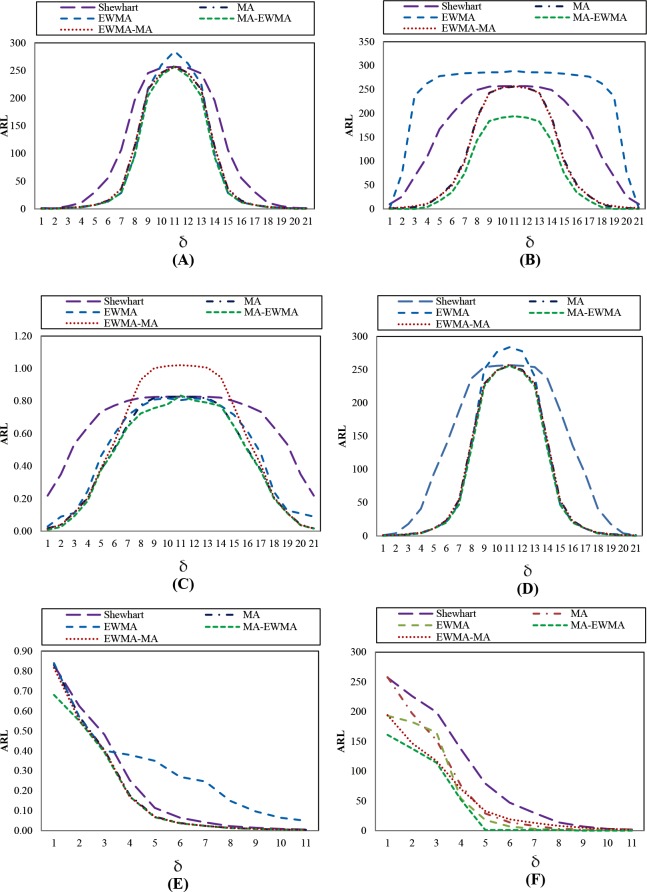
Fig 6.
This is the Fig 6 Comparative MRL performance of Shewhart, MA, EWMA, MA-EWMA and EWMA-MA charts with w = 5, λ = 0.25 and ARL0 = 370, under the symmetrical distributions:(A) Normal(0,1), (B) Laplace(0,1), (C) Logistic(6,2), (D) Student t10, and asymmetric distributions: (E) Exponential(1), and (F) Gamma(4,1) distributions.

