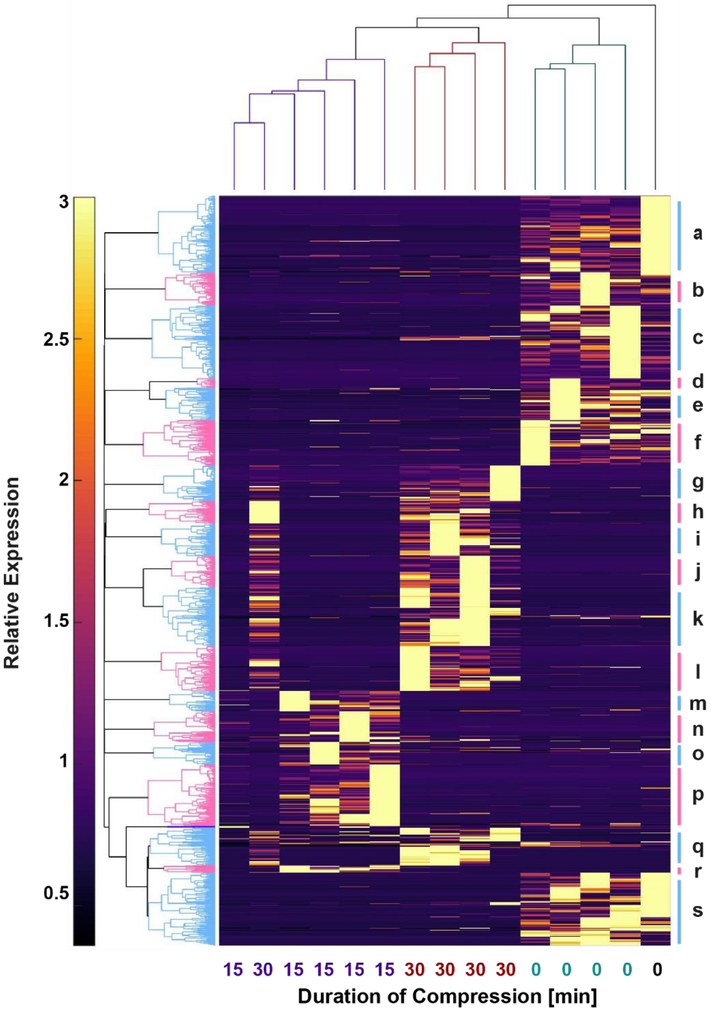
Figure 4. Clustering indicates strong effects of mechanical loading on global phosphoprotein expression.
Unsupervised clustering of all phosphoproteins detected in all samples conducted in MATLAB. Vertical dendrogram (top) indicates that the uncompressed controls (UC) were the most distinct samples, while there was similarity between the samples compressed 15 and 30 minutes. Individual clusters of phosphoproteins labeled alphabetically beginning on the top right. Pathways associated with these clusters shown in Supplementary File Pathway_Enrichment_Results.zip. Key cluster results shown in Table 3.

