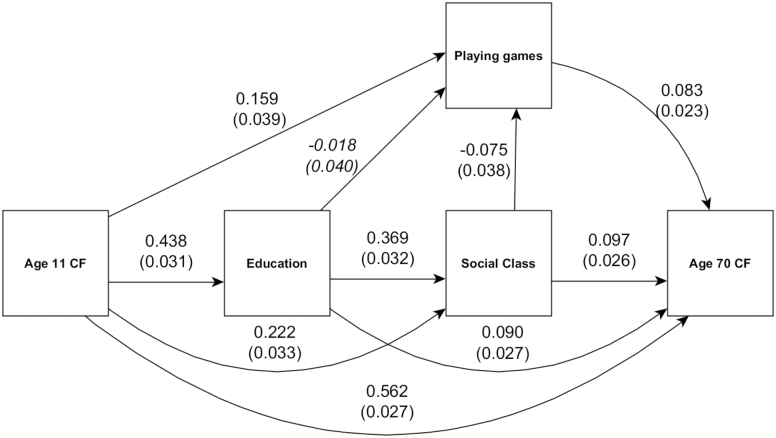
Figure 1.
Life course path diagram of the regressions among sociodemographic variables, cognitive functions, and playing games. Arrows indicate direction of the regression paths, with the numbers indicating std β weights and std errors (in parentheses). All paths are significant at p < .05, except for the path from education to playing games, printed in italics.

