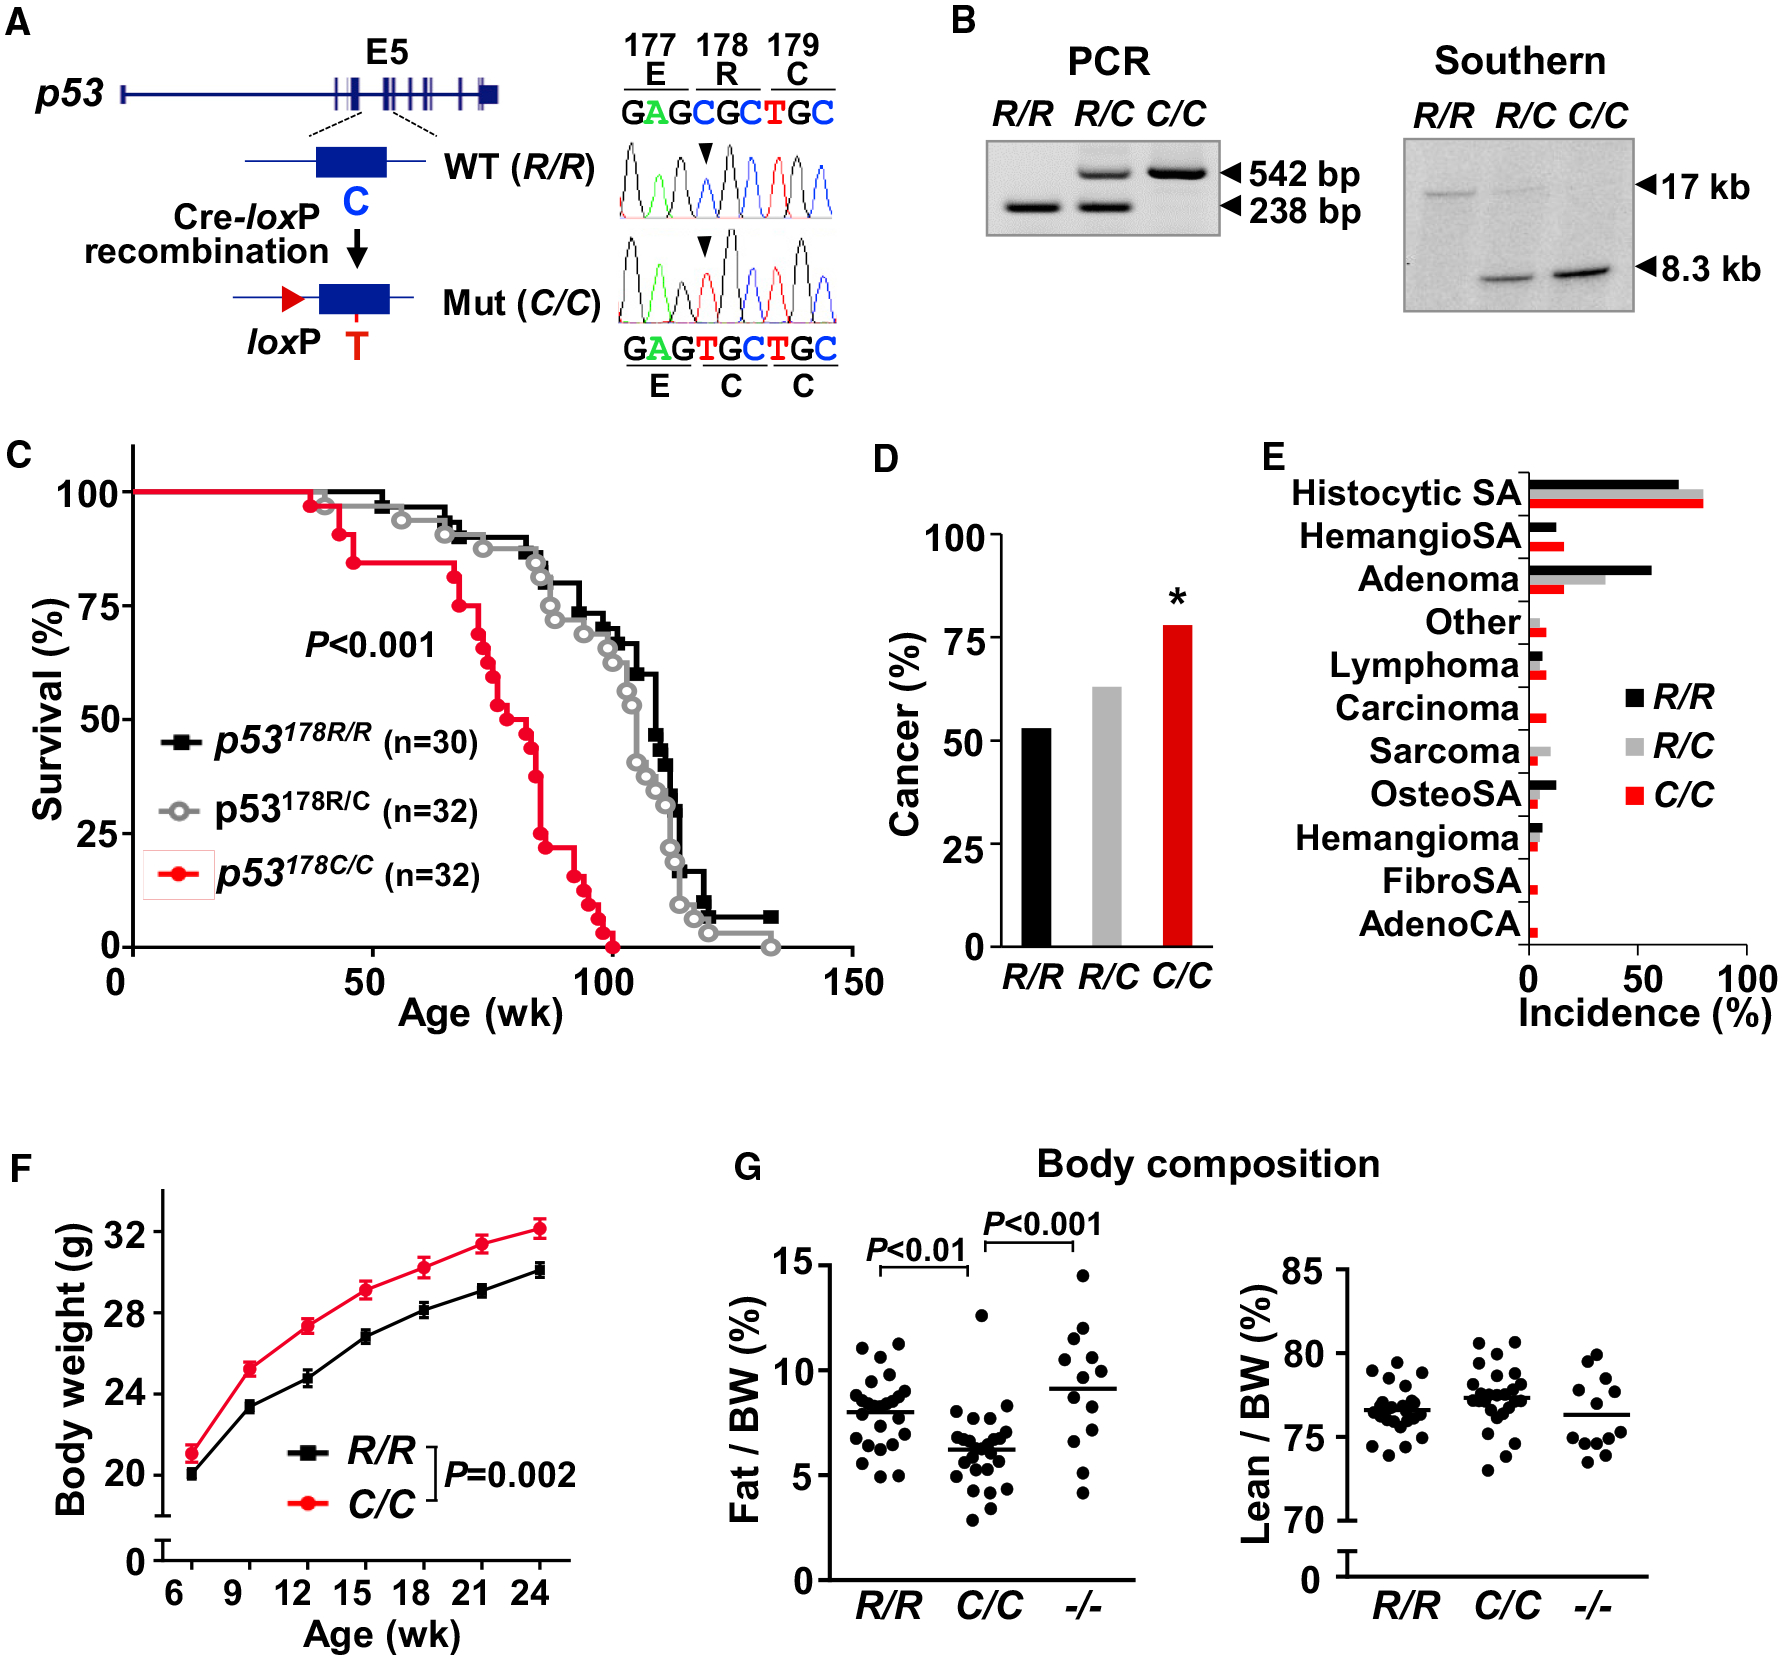
Figure 1. p53 R178C Knockin Mice Reveal Increased Cancer Incidence and a Metabolic Phenotype.

(A) Cre-loxP-mediated strategy for knockin of the amino acid R178C mutation into exon 5 (E5) of the mouse p53 gene. Mouse embryonic fibroblast (MEF) cDNA sequencing confirmed single-nucleotide substitution from C to T (right panel).
(B) Genomic DNA samples isolated from tail tissue and MEFs were analyzed by PCR and Southern blot, respectively. The 238-bp and 17-kb fragments correspond to the wild-type p53 allele. The 542-bp and 8.3-kb fragments correspond to the mutant p53 allele.
(C) Kaplan-Meier survival plot of the indicated p53 genotype mice. Median survival ages (weeks) were as follows: R/R, 109; R/C, 105; C/C, 80. Significance testing in comparison with wild-type p53.
(D) Cancer incidence in mice (R/R, n = 30; R/C, n = 32; C/C, n = 32).
(E) Spectrum of cancer types by p53 genotype (R/R, n = 16; R/C, n = 20; C/C, n = 25).
(F) Body weight of male mice by age (n ≥ 15).
(G) Fat and lean (muscle) body composition of 9-week-old male mice, measured by NMR analyzer (R/R, n = 25; C/C, n = 26; −/− , n = 13).
p53 R178 genotypes: wild-type p53178R/R (R/R), heterozygous mutant p53178R/C (R/C), homozygous mutant p53178C/C (C/C), and null p53−/− (−/−). Statistical difference by χ2 test in comparison with the wild-type (D), two-way ANOVA with repeated measures (F), and one-way ANOVA (G). Values are mean ± SEM. *p < 0.05. See also Figures S1–S3.
