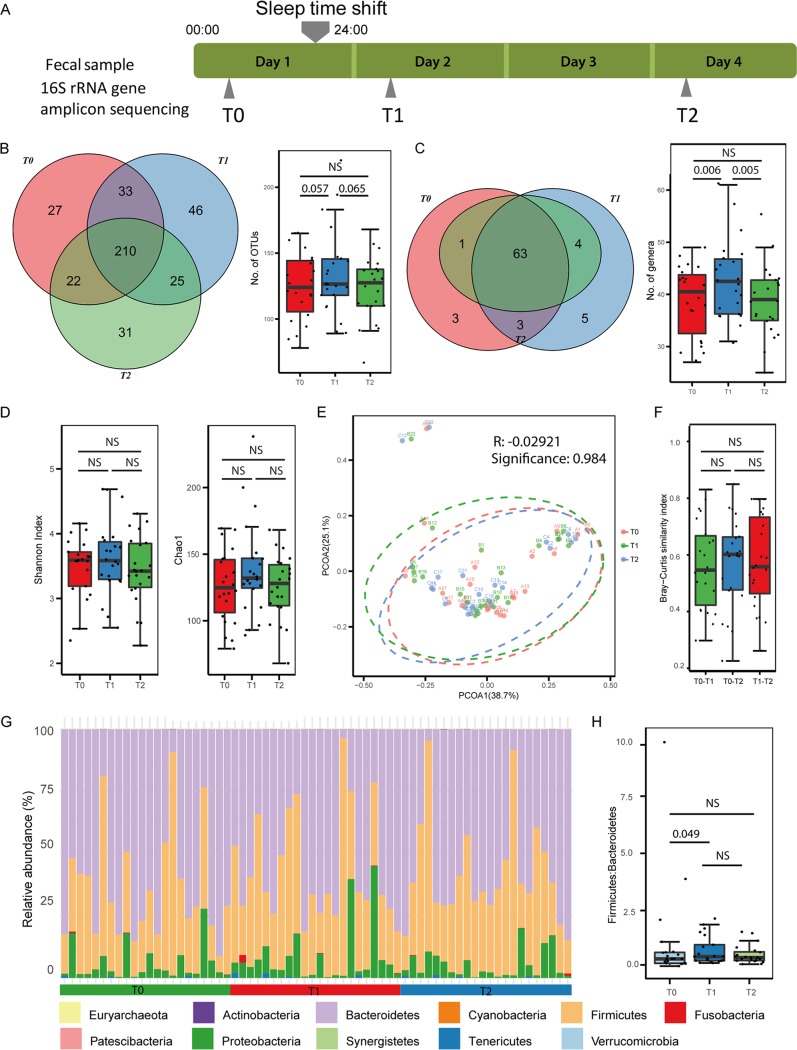
FIG 1.
Overview of the study and the gut microbiome. (A) Summary of the experimental design. (B) Venn diagram (left) and box plot (right) of the numbers of OTUs identified at baseline (T0), after the sleep-wake cycle shift (T1), and at recovery (T2). Dots in box plot show values in each individual. (C) Venn diagram (left) and box plot (right) of the numbers of genera identified at T0, T1, and T2. A significantly increased number of genera is observed after the sleep-wake cycle shift. Dots in box plot show values in each individual. (D) Alpha diversity values of the gut microbiomes at T0, T1, and T2. (E) Beta diversity values of the gut microbiomes at T0, T1, and T2. PCOA, principal coordinate axis. (F) Distribution of Bray-Curtis similarity index values between T0 and T1, T0 and T2, and T1 and T2. Dots in box plot show values in each individual. (G) Relative abundances of phyla in samples. (H) Firmicutes/Bacteroidetes ratios of gut microbiomes at T0, T1, and T2. NS, not significant.

