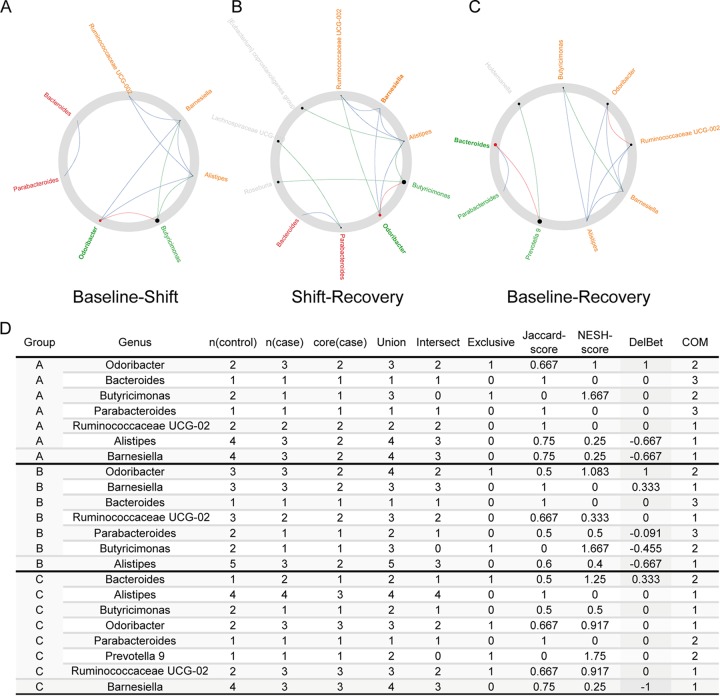
FIG 5.
The network drivers between each two time points. (A to C) The network drivers that drive network organization changes from baseline to shift (A), from shift to recovery (B), and from baseline to recovery (C). Red nodes represent the drivers identified by the NetShift method. The sizes of nodes are proportional to the NESH scores. (D) Summary of the node properties calculated by NetShift.

